Divergence RSI STOCH MACD CCI OBV CMF [PlungerMen]
Indicators seek divergence of prices
It graphs a few lines showing the divergence or convergence of the market
take signals from RSI, MACD, MACD Histogram, Stochastic, CCI, Momentum, OBV, Diosc, VWMACD and CMF
you can choose to take individual signal signals
** that's test versio n** have many not exactly =))
i will update soon when solving the algorithm
Search in scripts for "RSI MACD"

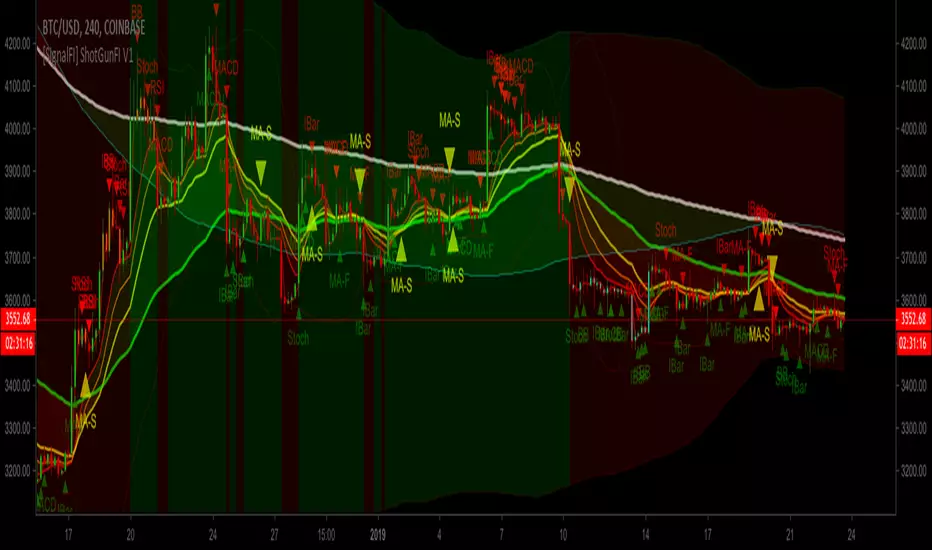
[SignalFI] ShotGunFI V1Welcome to ShotGunFI
In order to help give our members awareness of how major indicators move market price action, we created ShotGunFI. This script provides signals for the following indicators and gives a customizable framework for the user to track how certain indicators impact price and further how those impacts could relate to their overall strategy. We took the major indicators that are used in the market and smashed them into one chart with one indicator so that you can visualize a broad spectrum of strategies that are already driving price action.
This script is enabled with Data Leak and Repaint protection by default. Ensuring that signals are true.
The following indicators are included:
//+RSI Ob/Os Crossover Signals
- Candles are colored Orange and Aqua when RSI is overbought or oversold.
- Arrows and Alerts for crossover 30 and crossunder 70 RSI .
//+Slow Stochastic Signals
- Arrows and Alerts for crossover 20 and crossunder 80 Stoch RSI
//+MACD Bull/Bear Signals
- Arrows and Alerts for MACD Bull and Bear Signal line crossovers
//+MA Cross Bull/Bear Signals
- Arrows and Alerts for MA 1 Cross of MA 1 and MA 1 Cross of MA 4.
By default EMA is enabled, however, we included several other MA types to enhance and expand on this concept.
Included are the following MA types:
Kaufman Adaptive Moving Average ( KAMA )
Hull Moving Average
Smoothed Moving Average
Variable Index Dynamic Average
Fractal Adaptive Moving Average
Fractal Dimension Adaptive Moving Average
Double Exponential Moving Average
Least Squares Moving Average
Coefficient of Variation Weighted Moving Average
Simple Weighted Moving Average
Exponential Moving Average
Weighted Moving Average
Arnaud Legoux Moving Average
Option Types Labels:
"SWMA", "EMA", "WMA", "SMA", "HMA", "KAMA", "SMMA", "VIDYA", "VWMA", "ALMA", "FRAMA", "DEMA", "FDAMA", "LSMA", "COVWMA"
//+BollingBand Bull/Bear Signals
- Arrows and Alerts for lower BB crossover and higher BB crossover
//+Bollinger Band + RSI (BBRSI) Bull/Bear Signals
- Arrows and Alerts for custom higher timeframe Bollinger Band that integrates RSI . 4 Signals total.
//+InsideBar Bull/Bear Signals
- Arrows and Alerts for InsideBar bull/bear break combinations.
ALERTS DISABLED VERSION. Padaone Members Only.
SignalFI was created to help traders and investors to effectively analyze the market based on the Golden Mean Ratio (Fibonacci numbers), plan a trade and ultimately execute it. To help inform and educate market decisions we developed a set of Trading Indicators which are available on TradingView , the most advanced and yet easy to use charting platform available on the web.
SignalFI indicators are just that, indicators. Our indicators are generally configured to use completely historical data (negating repaint), and we advise all alerts created with SignalFI indicators to be fired upon "close" of the current candle. Our indicators can provide valuable context and visualization support when performing market analysis and executing buy and sell decisions. However. we are not financial experts, and all information presented on this site or our other media outlets are for educational purposes only.
For subscription information, visit www.signalfi.net and follow us on twitter.
On Balance Volume +This is the standard On Balance Volume indicator, with the addition of four things:
10-SMA
20-SMA
100-SMA
Bollinger Bands
I have found intriguing and surprising results with this indicator.
I often see OBV bouncing off of the Moving Average lines, much like support and resistance points.
More interesting is the fact that it "obeys" the bollinger bands. Often times, if OBV sneaks outside of the Bollinger Band, it will almost always correct and get back in the next day.
I would recommend that you find your own method, and PLEASE post in the comments as to how you use this, but I'll tell you
How I use this indicator:
I usually use this on the daily view. I tend to wait until OBV has moved above the red 20-Day SMA before considering an entry. Below that doesn't show enough positive volume for me to identify enough interest in the security. Once it breaks the red SMA, I'll look at other indicators for confirmation. If price is above the Bollinger Band up above, and my OBV is above Bollinger Band, I will not buy. Also, if MACD is dropping, or if the Stochastic RSI is pegged out in overbought land, I won't buy that either.
If, however, I'm seeing good stuff from Stochastic RSI, RSI, MACD, and price BB, then I'll take a long entry at that OBV + 20SMA crossover.
If I'm in a long position and I see a few signals like the OBV is above the BB, and price is above BB, and StochRSI or RSI are in/near overbought land, I'll often sell that day, expecting a pullback on price.
I really like this one, it's been quite helpful in my trading. This is my first venture into using Volume for trading, and it's been good so far.
Leave me a note in the comments to tell me how it goes and how you use this thing!

ProfitTrailer v2 LOWBB & RSI Buy SignalsThis script will display buy signals when configured LOWBB & RSI Conditions are met. I've created this script to help ProfitTrailer 2.0 subscribers understand when the bot will buy based on their selected RSI & BB values.
I will create more of these scripts so let me know in the comments if you would like to see some of the other strategies for example EMAGAIN + RSI + MACD or LOWBB + MACD etc. I will add the sell signals shortly.

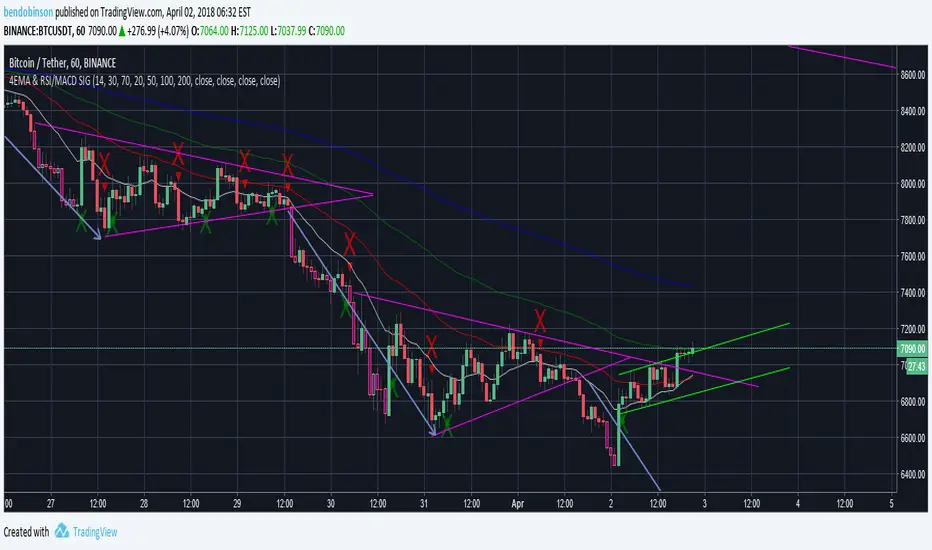
BD 4EMA RSI/MACD SIGNAL V1this chart allows 4 moving averages and gives a signal for macd cross over up and down as well as RSI oversold - purple - and overbought -yellow - all in 1 indicator.
Early Momentum Dashboard [Small Caps]Early Momentum Dashboard for Small Caps
A clean, real-time dashboard that detects building momentum before major moves in small-cap stocks.
Features:
• 7 key early-momentum indicators with traffic-light system (🟢 Bullish / 🟡 Neutral / 🔴 Bearish)
• Toggle each indicator on/off via settings
• Momentum Score (e.g., 5/7) – higher = stronger early signal
• Visual markers on chart (VOL, RSI, MACD)
• Includes: Relative Volume Spike, RSI Buildup, MACD, OBV Accumulation, ROC, ATR Volatility, VWAP Proximity
Ideal for scanning low-float or catalyst-driven small caps.
Tip: Look for 4+ green lights as a high-probability early entry signal.
Enjoy!

Vega Convexity Regime Filter [Institutional Lite]STOP TRADING THE NOISE.
90% of retail trading losses occur during "Chop"—sideways markets where standard trend-following bots bleed capital through slippage and fees. Institutional desks know that the secret to high returns isn't just winning trades; it's knowing when to sit in cash.
The Vega V6 Regime Filter is the "Gatekeeper" layer of our proprietary Hierarchical Machine Learning engine (developed by a 25-year TradFi Risk Quant). It calculates a composite volatility score to answer one simple question: Is this asset tradeable right now?
THE VISUAL LOGIC
This indicator visually filters market conditions into two distinct Regimes based on our institutional backtests:
🌫️ GREY BARS (Noise / Chop)
The State: Volatility is compressing. The trend is undefined or weak.
The Trap: This is where MACD/RSI give false signals.
Institutional Action: Sit in Cash. Preserve Capital. Wait.
🟢 🔴 COLORED BARS (Impulse)
The State: Volatility is expanding. Momentum is statistically significant.
The Opportunity: A "Fat-Tail" move is likely beginning.
Institutional Action: Deploy Risk. Look for entries.
HOW IT WORKS (The Math)
Unlike simple moving average crossovers, the Vega Gatekeeper analyzes 4 distinct market dimensions simultaneously to generate a Tradeability Score (0-10) :
Trend Strength (ADX): Is there a vector?
Momentum (RSI/MACD): Is the move accelerating?
Volatility (Bollinger Bands): Is the range expanding?
Volume Flow: Is there institutional participation?
The Rule: If the composite score is < 4 , the market is Noise. The bars turn Grey. You do nothing.
BEST PRACTICES
For Swing Trading (Daily): Use Medium sensitivity. Only look for entries when the background turns Green/Red.
For Day Trading (4H/1H): Use Low sensitivity (more conservative). Use the Grey zones to tighten stops or exit positions.
THE PHILOSOPHY: "CASH IS A POSITION"
Most traders feel the need to be in a trade 24/7. The Vega V6 Engine (the system this tool is based on) achieved a +3,849% backtested return (18 months) largely by sitting in cash during chop. This tool visualizes that discipline.
🔒 WANT THE DIRECTIONAL SIGNALS?
This Lite version provides the Regime (When to trade).
To get the specific Entry Signals , Intraday Stop-Losses , and Probability Matrix (Stage 2 of our model), you need the Vega V6 Convexity Engine .
The Pro Version includes:
🚀 Specific Direction: Classification of "Explosion," "Rally," or "Crash."
🛡️ Dynamic Risk: Plots the exact Stop Loss levels used in our institutional backtests.
🌊 Macro Data: Integration of M2 Liquidity flow alerts.
👉 ACCESS INSTRUCTIONS:
Links to the Pro System , our Live Dashboard , and the 18-Month Performance Audit can be found in the Author Profile below or in the script settings.
Disclaimer: This tool is for educational purposes only. Past performance is not indicative of future results. Trading cryptocurrencies involves significant risk.

Trend Gazer: Unified ICT Trading System with Signals# Trend Gazer User Guide (English)
## 📖 Table of Contents
1. (#about-this-indicator)
2. (#quick-start-guide-3-steps)
3. (#detailed-usage)
4. (#settings-customization)
5. (#why-combine-multiple-features)
6. (#faq)
---
## About This Indicator
**Trend Gazer** is an integrated trading system designed to read institutional order flow like professional traders.
### 🎯 3 Problems This Indicator Solves
#### ❌ Problem 1: Too Many Indicators = Information Overload
```
Normal: RSI + MACD + Moving Average + Bollinger Bands... → Cluttered chart
Solution: All integrated into ONE indicator → Clean & Clear
```
#### ❌ Problem 2: Single Indicators Give False Signals
```
Normal: Enter based on RSI alone → Frequent stop-outs
Solution: Structure × Zone × Momentum multi-angle confirmation → Higher win rate
```
#### ❌ Problem 3: Unclear Entry Timing
```
Normal: Know the trend but don't know WHERE to enter
Solution: LS Bounce Signal shows EXACT entry points
```
---
## Quick Start Guide (3 Steps)
### 🚀 STEP 1: Confirm Trend Direction
**Look for CHoCH (Change of Character)**
```
📍 (1.CHoCH) label = Uptrend starting
📍 (a.CHoCH) label = Downtrend starting
```
**Important**: Wait for CHoCH! No direction without it.
---
### 🎯 STEP 2: Find Entry Points
**Wait for LS Bounce Signal (green/red labels)**
```
🟢 "Long@ HL only" label → LONG (buy) candidate
🔴 "Short@ LH only" label → SHORT (sell) candidate
```
**Label text color meaning**:
- **White text**: Clean trend (high confidence)
- **Yellow text**: Trend transition (moderate caution)
---
### 🛡️ STEP 3: Final Confirmation with Bar Color
**Bar color shows market state**
```
🔴 Red bar: BUY zone (buying is favored)
🟢 Green bar: SELL zone (selling is favored)
⚪ White bar: Neutral (wait and see)
```
---
## Detailed Usage
### 📊 Understanding the Chart
#### 1. Labels (Market Structure Changes)
```
(1.CHoCH) / (a.CHoCH) : Trend reversal
(2.SiMS) / (b.SiMS) : Momentum confirmation
(3.BoMS) / (c.BoMS) : Trend continuation
```
#### 2. Boxes (Institutional Order Zones)
```
📦 Blue boxes: Bullish OB (buy orders accumulated)
📦 Red boxes: Bearish OB (sell orders accumulated)
📦 Black transparent boxes: Liquidity Sweep
```
**How to use Order Blocks**:
- Function as support/resistance
- Signals within OB have higher reliability
- Use for stop-loss placement
#### 3. Lines (Trends and Support/Resistance)
```
━━━ Red lines: EMA20, EMA50, EMA100 (short to mid-term trends)
━━━ Blue lines: 60min NPR/BB bands (support/resistance)
```
#### 4. Bar Colors (Filter 6)
```
Bar color = Real-time market state
🔴 Red: Buying is favored
🟢 Green: Selling is favored
⚪ White: Neutral
```
---
### 🎯 Practical Trading Flow
#### 📍 Preparation Phase
```
1. Open chart (recommended: 5min or 15min)
2. Add Trend Gazer to chart
3. Start in observation mode (don't enter yet)
```
#### 📍 Entry Decision
```
✅ CHoCH confirms direction → Uptrend starting
✅ LS Bounce Signal "Long@ HL only" appears
→ Entry point candidate
✅ Bar turns red → Market supports buying
→ Entry decision 🎯
✅ Place stop below nearest Order Block (blue box)
```
#### 📍 Exit Decision
```
🔴 Opposite LS Bounce Signal "Short@ LH only" appears
→ Consider taking profit
🔴 Bar turns green
→ Potential trend reversal, review position
🔴 Stop loss hit
→ Exit with loss
```
---
### 💡 Tips for Higher Win Rate
#### ✅ DO's
```
1. Enter AFTER CHoCH appears
2. Prioritize white-text LS Bounce Signals
3. Check higher timeframe (1H or Daily) trend
4. Emphasize signals within Order Blocks
5. Use bar color as final confirmation
```
#### ❌ DON'Ts
```
1. Enter before CHoCH → No clear direction
2. Enter only on yellow text → Unstable transition period
3. Ignore bar color → Trading against market state
4. Don't check Order Blocks → Unclear support/resistance
5. Enter same direction consecutively → Overtrading
```
---
## Settings Customization
### 🔧 How to Open Settings
```
1. Right-click on indicator name on chart
2. Select "Settings..."
3. Settings panel opens
```
---
### 📋 Recommended Setting Profiles
#### 🔰 Beginner Settings (Simple)
**Goal**: Reduce noise, show only important signals
```
【FILTERS】
✅ Bonus Filter: ON
✅ Filter 6 (OB/BB/NPR Zone Filter): ON
❌ Direction Filter: OFF
❌ Liquidation Reversal Filter: OFF
❌ ICT Market Structure Filter: OFF
❌ EMA Trend Filter: OFF
❌ OB/FVG Filter 1: OFF
❌ OB/FVG Filter 2: OFF
【SIGNALS】
✅ Signal 0 (Bonus): ON
✅ Signal 1 (VWC Change): ON
✅ Signal 2 (Liq Rev): ON
❌ Signal 3 (LS): OFF (complex alone)
❌ Signal 4 (LS Break): OFF
❌ Signal 5 (OB+LS NPR): OFF
❌ Signal 6 (OB+LS EMA): OFF
【LS BOUNCE SIGNAL】
✅ Exclude EMA50 from touch detection: OFF
❌ Only show when EMA fills are mixed: OFF
```
**What happens with this setup**:
- Only Bonus (black background) signals display
- LS Bounce Signals clearly visible
- Noisy signals filtered out
---
#### 💪 Intermediate Settings (Balanced)
**Goal**: Enable key filters for better accuracy
```
【FILTERS】
✅ Bonus Filter: ON
✅ Filter 6 (OB/BB/NPR Zone Filter): ON
✅ ICT Market Structure Filter: ON
❌ Direction Filter: OFF
❌ Liquidation Reversal Filter: OFF
❌ EMA Trend Filter: OFF
❌ OB/FVG Filter 1: OFF
❌ OB/FVG Filter 2: OFF
【SIGNALS】
✅ Signal 0 (Bonus): ON
✅ Signal 1 (VWC Change): ON
✅ Signal 2 (Liq Rev): ON
✅ Signal 3 (LS): ON
❌ Signal 4 (LS Break): OFF
❌ Signal 5 (OB+LS NPR): OFF
❌ Signal 6 (OB+LS EMA): OFF
【LS BOUNCE SIGNAL】
✅ Exclude EMA50 from touch detection: OFF
❌ Only show when EMA fills are mixed: OFF
```
**What happens with this setup**:
- Signals only after CHoCH (trend confirmed)
- Filter 6 changes bar colors
- Liquidity Sweeps also displayed
---
#### 🚀 Advanced Settings (Full Utilization)
**Goal**: Master all features
```
【FILTERS】
✅ Bonus Filter: ON
✅ Filter 6 (OB/BB/NPR Zone Filter): ON
✅ ICT Market Structure Filter: ON
✅ Direction Filter: ON
✅ EMA Trend Filter: ON
❌ Liquidation Reversal Filter: OFF (optional)
✅ OB/FVG Filter 1: ON
✅ OB/FVG Filter 2: ON
【SIGNALS】
✅ All ON
【LS BOUNCE SIGNAL】
✅ Exclude EMA50 from touch detection: ON (reduce EMA50 noise)
✅ Only show when EMA fills are mixed: ON (show only transition zones)
```
**What happens with this setup**:
- Fewer signals (precision-focused)
- Multiple confirmations greatly reduce false signals
- Only signals confirmed by trend, momentum, and zones
---
### 🎨 Display Customization
#### Change Label Size
```
【BUY/SELL SIGNAL APPEARANCE】
→ "BUY/SELL Label Size"
→ Choose from: tiny / small / normal / large / huge
Recommended: small (default)
```
#### Order Block Display Settings
```
【ORDER BLOCK (OB) SETTINGS】
✅ Show Current TF OB: Current timeframe OB
✅ Show 1min OB: 1-minute OB
✅ Show 5min OB: 5-minute OB
✅ Show 15min OB: 15-minute OB
Recommended: Only 15min OB ON (simple)
```
#### Liquidity Sweep Display
```
【LIQUIDITY SWEEPS SETTINGS】
→ "Sweep Length": Sensitivity (small=frequent, large=selective)
→ "Sweep Option": Standard / Maximum
Recommended: Length=40, Option=Standard
```
#### NPR/BB Bands Display
```
【NPR (NON-REPAINT STDEV) SETTINGS】
✅ Display 60min NPR Bands: 60-minute support/resistance
❌ Display Current TF NPR Bands: Current timeframe (optional)
Recommended: Only 60min ON
```
---
### ⚙️ Advanced Settings
#### Fine-tune Filter 6
```
【FINAL FILTERS】
→ "Enable Filter 6 (OB/BB/NPR Zone Filter)"
When ON:
- Bars color-coded red/green/white
- Behavior at OB, NPR/BB touches controlled
```
#### LS Bounce Signal Adjustments
```
【LS BOUNCE SIGNAL】
→ "Exclude EMA50 from touch detection"
OFF: Detect NPR/BB/EMA50 (all 3)
ON: Detect NPR/BB only (exclude EMA50)
→ "Only show when EMA fills are mixed"
OFF: Show all LS Bounce Signals
ON: Show only transition zone signals (yellow text)
```
#### MTF (Multi-Timeframe) Control
```
【ORDER BLOCK (OB) SETTINGS】
→ "Disable MTF on 1hr+ Charts"
ON: Disable MTF on 1H+ (save memory)
OFF: MTF enabled on all timeframes
Recommended: ON (unnecessary on larger timeframes)
```
---
### 🎯 Purpose-Based Configuration Guide
#### 🔍 Goal 1: Reduce Signal Count
```
✅ Bonus Filter: ON
✅ ICT Market Structure Filter: ON
✅ Filter 6: ON
✅ All Signals OFF, only Signal 0 ON
```
#### 🔍 Goal 2: Get More Signals
```
❌ All Filters OFF
✅ All Signals ON
```
#### 🔍 Goal 3: Trend Following Only
```
✅ ICT Market Structure Filter: ON
✅ Direction Filter: ON
✅ EMA Trend Filter: ON
```
#### 🔍 Goal 4: Counter-Trend Trading
```
✅ LS Bounce Signal: ON
✅ Filter 6: ON
❌ ICT Market Structure Filter: OFF
```
#### 🔍 Goal 5: Day Trading (5-15min charts)
```
✅ Show 15min OB: ON
✅ Display 60min NPR Bands: ON
✅ LS Bounce Signal: ON
❌ Show 1min/5min OB: OFF
```
#### 🔍 Goal 6: Scalping (1-5min charts)
```
✅ Show 5min OB: ON
✅ Show 15min OB: ON
✅ Display 60min NPR Bands: ON
✅ All Signals: ON
```
---
### 💾 Saving and Loading Settings
#### Save Settings
```
1. Click "..." in top-right of Settings screen
2. Select "Save as default"
→ Same settings auto-applied next time
```
#### Reset Settings
```
1. Click "..." in top-right of Settings screen
2. Select "Reset settings"
→ Return to default settings
```
---
## Why Combine Multiple Features?
### 🎯 Problem: Single Indicator Limitations
Common trader problems:
```
❌ RSI alone → Trade against trend, lose
❌ Moving Average alone → Late entry timing
❌ Support/Resistance alone → Caught by false breakouts
```
**Markets are complex**. One angle isn't enough.
---
### 💡 Solution: Multi-Angle Integrated Approach
#### 1️⃣ Structure × Zone × Momentum
```
📐 Structure (ICT CHoCH)
→ "Which direction is likely?"
📦 Zone (OB/NPR/BB)
→ "Where will price react?"
💨 Momentum (EMA/VWC)
→ "Is there momentum now?"
```
**When all 3 align = Highest win-rate timing**
---
#### 2️⃣ Multi-Timeframe Analysis
```
Big picture: Confirm Daily direction
Medium-term: Check 1H Order Blocks
Short-term: Time entry on 5min
```
**Short-term entries aligned with higher timeframes = Better win rate**
---
#### 3️⃣ Understanding Liquidity
```
🎣 Institutional strategy:
1. Intentionally move price opposite to stop out retail
2. Then, move in real direction
💡 Liquidity Sweep = Visualize this "trap"
→ Read institutional order flow
```
---
### 🧠 Integration Examples
#### Case 1: RSI Alone vs Integrated System
**Scenario**: RSI at 30 (oversold)
```
❌ RSI-only decision:
→ "Buy!"
→ But downtrend continues, loss 😢
✅ Trend Gazer:
CHoCH check → Still downtrend ❌
Order Block → In Bearish OB ❌
LS Bounce → SHORT signal only ❌
→ Skip or SHORT
→ Avoid loss ✅
```
**Result**: Multiple filters block wrong entry
---
#### Case 2: LS Bounce Signal 2-Stage Logic
**Scenario**: Price touches 60min NPR lower band
```
🔍 Traditional method:
Touched → Buy!
→ But price continues down 😢
✅ Trend Gazer:
Stage 1: NPR touch + red bar → Flag ON
Stage 2: EMA20 crosses above EMA50 → Confirm bounce
→ Now "Long@ HL only" displays
→ Entry → Success ✅
```
**Result**: Not just "touch" but "touch + bounce confirmation" improves accuracy
---
### 🎓 Progressive Learning Design
This indicator is designed for **beginners to advanced**:
```
📖 Beginner (Month 1):
Use only CHoCH + LS Bounce Signal
→ Learn trend and entry points
📖 Intermediate (Months 2-3):
Add Order Block + Bar Color
→ Learn support/resistance and filtering
📖 Advanced (Month 6+):
Master all features
→ Read institutional order flow
```
**Ultimate goal**: Indicator becomes confirmation tool. Your market sense becomes primary.
---
### 🔬 Technical Advantages
#### 1. Non-Repaint STDEV (NPR)
```
Normal Bollinger Bands:
→ Past data changes (repaints)
→ Inaccurate backtesting
NPR:
→ Past data doesn't change (non-repaint)
→ Reliable verification possible
```
#### 2. 2-Stage Signal Logic
```
Traditional: Condition met → Immediate signal
→ Many false signals
Trend Gazer: Condition1 → Flag ON → Condition2 → Signal
→ Confirmation step improves accuracy
```
#### 3. Alternating Filter
```
Problem: Same-direction signals spam
→ Overtrading
Solution: LONG → SHORT → LONG alternating only
→ Prevent unnecessary entries
```
---
### 💎 Conclusion: Why Integration?
```
Single indicator = "Partial truth"
Integrated system = "3D market perspective"
```
**Markets are multifaceted**. One angle isn't enough.
Trend Gazer **integrates multiple screens pros watch simultaneously into ONE**,
allowing beginners to read charts with institutional perspective.
---
## FAQ
### ❓ Q1: Which timeframe is best?
**A**: Depends on trading style
```
Scalping: 1min ~ 5min
Day Trading: 5min ~ 15min
Swing: 1H ~ 4H
```
**Important**: LS Bounce Signal only works on 30min and below.
---
### ❓ Q2: Too many signals, confused
**A**: Enable filters
```
【Recommended Settings】
✅ Bonus Filter: ON
✅ Filter 6: ON
✅ ICT Market Structure Filter: ON
→ Show only Signal 0
```
This significantly reduces signal count.
---
### ❓ Q3: No CHoCH appearing, what to do?
**A**: Wait or check higher timeframe
```
Method 1: Wait for CHoCH (recommended)
Method 2: Check higher timeframe (e.g., Daily) for trend
Method 3: Disable ICT Filter (not recommended)
```
**When trend is unclear, sitting out is also strategy**.
---
### ❓ Q4: LS Bounce Signal not appearing
**A**: Checkpoints
```
1. Are you on 30min or below chart?
→ Doesn't show on 1H+
2. Are NPR/BB bands displayed?
→ Check Settings "Display 60min NPR Bands"
3. Is EMA50 excluded?
→ If "Exclude EMA50" is ON, EMA50 signals won't show
```
---
### ❓ Q5: Bar color not changing?
**A**: Check Filter 6
```
Settings → FINAL FILTERS
→ Confirm "Enable Filter 6 (OB/BB/NPR Zone Filter)" is ON
If ON but still not changing:
→ Current price may be outside OB/NPR/BB zones
```
---
### ❓ Q6: Too many Order Blocks, hard to see
**A**: Narrow down displayed OBs
```
Settings → ORDER BLOCK (OB) SETTINGS
Recommended:
❌ Show Current TF OB: OFF
❌ Show 1min OB: OFF
❌ Show 5min OB: OFF
✅ Show 15min OB: ON (only this)
```
---
### ❓ Q7: How to improve win rate?
**A**: Thorough multiple confirmations
```
Checklist:
✅ CHoCH appeared
✅ LS Bounce Signal (white text)
✅ Bar color matches (red bar=LONG, green bar=SHORT)
✅ Signal within Order Block
✅ Aligns with higher timeframe trend
Enter ONLY when all align
```
---
### ❓ Q8: Want to practice on demo
**A**: Recommended practice method
```
Week 1: Observation only
→ Watch signals and chart movement
→ Resist entering
Weeks 2-3: Keep records
→ Screenshot when signal appears
→ Record subsequent movement
Week 4+: Start demo trading
→ Start with small amounts
→ Continue keeping records
```
---
### ❓ Q9: Are there alert features?
**A**: Yes, multiple alerts available
```
Setup method:
1. Right-click indicator on chart
2. Select "Add Alert..."
3. Choose from:
- ANY ALERT: BUY/SELL Signals
- BUY ONLY ALERT
- SELL ONLY ALERT
- MS UP / MS DOWN
- BAR COLOR: RED / LIME
- LS BOUNCE: LONG / SHORT Signal
```
---
### ❓ Q10: Works on other markets?
**A**: Yes, works on all markets
```
✅ Cryptocurrency (BTC, ETH, etc.)
✅ Forex (EUR/USD, USD/JPY, etc.)
✅ Stocks (individual stocks, indices)
✅ Futures (oil, gold, etc.)
```
Works on any market with price and volume data.
---
## 📋 Disclaimer
### ⚠️ Important Notice
This indicator is for **educational and informational purposes only**.
```
❌ NOT investment advice
❌ Does NOT guarantee profits
❌ Past results do NOT guarantee future performance
```
### Risk Warning
```
⚠️ Trading involves substantial risk
⚠️ Only trade with funds you can afford to lose
⚠️ Practice extensively on demo account before live trading
⚠️ Make your own informed decisions and act at your own risk
```
---
## 📞 Support
### Feedback & Questions
Feel free to ask questions in TradingView comments section.
### Bug Reports
Please report with specific details (timeframe, symbol, screenshots).
---
**Author**: rasukaru666
**License**: Mozilla Public License 2.0
**Last Updated**: December 2025
**Version**: Latest
---
**Thank you for using Trend Gazer!**
**Happy Trading! 📈**
---------------

MTF RSI + MACD Bullish Confluencethis based on rsi more then 50 and macd line bullish crossover or above '0' and time frame 15 min, 1 hour, 4 hour , 1 day and 1 week

TSO Lite v2 — Early Momentum Flip Signal (Free)✅ TSO Lite v2 — Momentum Ignition Signal (Free Version)
(Created by a Korean trader — structural momentum research)
Most indicators react late.
TSO Lite v2 shows the exact moment internal bullish momentum flips upward.
The green triangle is not decoration —
it’s the structural ignition point where upward momentum breaks above the internal zero-line.
👉 Zero-line breakout = internal momentum shift
👉 If the triangle appears, the shift is already underway
This signal is high-purity, valid only inside a bullish trend, and never repaints.
🔥 Why Lite v2 Feels Different
Structural momentum, not lagging averages
Valid only in bullish trend → naturally cleaner accuracy
No repainting
Detects transitions earlier than RSI / MACD
Minimal, focused, and fast
If the triangle shows → momentum is turning.
If it doesn’t → the market isn’t ready.
🟢 Essence of Lite v2
Green Triangle = first pulse of upward structural energy
You define the trend (MA, HTF regime, your own system).
Lite shows the ignition moment.
📊 Lite v2 vs PRO Engine (Information Only)
(No purchase pressure — simple comparison)
Feature Lite v2 (Free) TSO PRO (Full Engine)
Entry Triangles Green only (bullish) Green + Red (bidirectional)
Valid Condition Bull trend only Trend-aligned (bull/bear)
Structural Filtering ✗ ✓
Leading Momentum Engine Basic Multi-layer
Compression / Turning Zone ✗ ✓
Automation (Webhook) ✗ ✓
User Level Beginner Advanced / automation
Lite shows the moment momentum turns upward.
PRO interprets the entire structural engine.
⚠ Important
This indicator does not repaint.
PRO Flow formulas remain private for licensing and security.
Access to PRO is granted manually (invite-only).
🔑 TSO PRO Subscription (Optional - User Requested Links)
If you want the full structural engine:
• Monthly: tradesmith6.gumroad.com
• Yearly: tradesmith6.gumroad.com
(Yearly offers ~32% savings)
To activate access after purchase, send your TradingView username via DM.
Developer: Korean trader.
🇰🇷 TSO Lite v2 — 상승 모멘텀 점화 신호 (무료 버전)
(한국 트레이더 제작)
대부분의 지표는 늦게 반응합니다.
TSO Lite v2는 내부 상승 모멘텀이 전환되는 “그 순간”을 보여줍니다.
녹색 삼각형은 단순 신호가 아니라
내부 모멘텀이 0선을 돌파하는 상승 점화 지점입니다.
👉 0선 돌파 = 방향 전환 시작
👉 삼각형이 나타난 시점에는 이미 전환이 진행 중
이 신호는 상승 추세에서만 유효한 고순도 구조 신호이며,
한 번 표시되면 리페인트되지 않습니다.
🔥 Lite v2가 강력한 이유
평균값이 아닌 구조 기반 모멘텀 분석
상승 추세에서만 유효 → 신뢰도 향상
리페인트 없음
RSI/MACD보다 빠른 전환 감지
단순하면서도 강력한 상승 초기 신호
삼각형이 뜨면 → 모멘텀이 상승 전환
안 뜨면 → 시장은 아직 준비되지 않음
🟢 Lite v2의 핵심
녹색 삼각형 = 상승 구조 에너지의 첫 펄스
추세는 사용자가 정의합니다.
Lite는 “점화 순간”을 알려줍니다.
📊 Lite v2 vs PRO (정보 제공용)
기능 Lite v2 (무료) TSO PRO (전체 엔진)
진입 신호 녹색(상승전용) 녹/적(상승·하락)
신호 유효 조건 상승 추세 각 추세 정합 조건
구조 필터링 ✗ ✓
선행 모멘텀 엔진 기본 다층 구조
압축·턴닝존 ✗ ✓
자동매매 ✗ ✓
Lite는 상승 초기 모멘텀을 배우는 무료 버전,
PRO는 실전 구조 엔진입니다.
⚠ 중요 안내
이 지표는 리페인트 되지 않습니다.
PRO는 라이선스 보호를 위해 공식 공식(Formula)이 비공개로 유지됩니다.
PRO 접근은 인바이트 기반으로 수동 승인됩니다.
🔑 TSO PRO 구독 링크 (요청된 링크 삽입)
• 월간: tradesmith6.gumroad.com
• 연간: tradesmith6.gumroad.com
구매 후 TradingView ID를 DM으로 보내면 접근이 수동으로 부여됩니다.
개발자: 한국 트레이더

PRO Triple+ Confirmation Overlay SignalsThis script uses the 200 SMA + RSI + MACD confirmations as buy and sell signals. It only give a signal if all three line up. works well for general market direction signals. It also has a higher time frame filter that will filter out 70%-90% of traps and counter trend signals. MACD momentum trigger times entries with momentum shifts. RSI confirmation as well as volume confirmation to remove entries in low volume dead markets.

🌊 QUANTUM FLOW PRO - Ultimate Trading System🌊 QUANTUM FLOW PRO - Ultimate Trading System
Description:
QUANTUM FLOW PRO (QFP) is a comprehensive, all-in-one professional trading ecosystem designed for Crypto, Forex, and Stock markets. Unlike simple indicators that rely on a single metric, QFP combines Trend Analysis, Volume Profiles, Order Flow, and Institutional Accumulation logic into a single, powerful decision-making engine.
This system calculates a "Signal Score" (0-100) for every potential trade by analyzing over 10 different technical factors simultaneously.
🚀 KEY FEATURES
1. 🧠 Smart Signal Scoring System Every Buy or Sell signal is not just a guess; it is the result of a complex calculation. The system evaluates:
Trend: SuperTrend & EMA confluence.
Momentum: RSI, MACD, and Stochastic levels.
Volume: Money Flow, OBV, and Volume Z-Score.
Multi-Timeframe (HTF): Checks 4H and Daily trends for confirmation.
Result: You get a score (e.g., 85/100) indicating the probability of success.
2. 🐋 Whale & Accumulation Detection Identify where big players are positioning themselves before the move happens.
Purple Zones: High Accumulation areas (potential explosive breakouts).
Whale Activity: Detects unusual volume spikes often associated with institutional entries.
Consolidation: Measures volatility contraction to predict expansion.
3. 🔵 Order Flow & Pressure Visualize the battle between buyers and sellers directly on the chart.
Green/Red Dots: Show real-time Buying or Selling pressure based on price-volume divergence.
Order Walls: Identifies potential liquidity zones where price might stall or reverse.
4. 💰 Advanced Risk Management Stop guessing your exits. QFP provides dynamic levels automatically:
Entry, Stop Loss, and 3 Take Profit Levels.
Methods: Choose between ATR-based (Volatility), Fibonacci-based, or a Hybrid calculation.
Win Probability: Shows the statistical probability of reaching the next target (DN1, DN2, DN3).
5. 📊 Professional Dashboard A sleek, non-intrusive panel displaying:
Current Trend & Strength.
HTF Status.
RSI, MACD, VWAP status.
Accumulation Score & Volume Health.
🛠️ HOW TO USE
Select your Mode:
Conservative: Best for beginners. Fewer signals, higher confirmation (Wait 30 bars).
Balanced: Standard approach for day trading.
Aggressive: For scalping and volatile markets.
Wait for a Signal:
Look for the "STRONG BUY" (Green Triangle) or "STRONG SELL" (Red Triangle) labels.
Check the Score on the label (e.g., Score: 75/60). Higher is better.
Confirm with Dashboard:
Ensure the "Trend" and "HTF" (Higher Timeframe) match the signal direction.
Look for "Healthy" volume.
Execute & Manage:
Enter the trade.
Place your Stop Loss at the suggested SL line.
Take partial profits at TP1 and TP2.
Move SL to Breakeven after TP1 is hit (the script suggests this visually).
⚙️ SETTINGS OVERVIEW
Market Type: Optimize calculations for Crypto, Forex, or Stocks (BIST).
Risk Level: Low, Medium, High (Adjusts the signal threshold score).
TP Method: Hybrid (Recommended) blends ATR and Fib levels for precision.
⚠️ DISCLAIMER
This tool is for educational and analytical purposes only. Trading involves significant risk. Always perform your own due diligence and never trade with money you cannot afford to lose

Enhanced Multi-Indicator StrategyEnhanced Multi-Indicator Strategy v7 is a trend-following confirmation tool that combines several classic indicators into one clear “voting system.”
Instead of relying on a single signal, this script counts how many indicators agree on a bullish or bearish bias and only fires when the majority lines up and the trend is strong.
It’s designed to help you:
Filter out low-quality signals
Avoid trading against the dominant trend
Get clean, one-time BUY/SELL markers instead of noisy spam signals
How it Works
The indicator evaluates up to 10 components on each bar:
Trend & Structure
Moving Average (MA 50)
EMA Fast (20) vs EMA Slow (50)
Momentum
RSI (14)
MACD (12/26/9)
KDJ
Volatility & Price Location
Bollinger Bands (20, 2)
VWAP
Volume
Volume vs Volume MA (20)
Trend Strength & Direction
ADX + DMI (trend strength and up/down direction)
Optional
Ichimoku Cloud (price vs Senkou A/B)
Each indicator votes bullish or bearish.
The script then:
Counts how many are bullish → bullish_count
Counts how many are bearish → bearish_count
Requires at least Min Indicators for Entry (user-defined) to agree in one direction
Requires ADX above a threshold (default 20) to confirm trend strength
(Optionally) forces entries to follow the DMI trend:
Longs only in uptrends
Shorts only in downtrends
Only when these conditions are met does the script consider a valid long zone or short zone.
Signals: 1x Fire + Cooldown
To keep the chart clean and prevent over-trading:
A BUY arrow is plotted only on the first bar when price enters a new bullish zone.
A SELL arrow is plotted only on the first bar when price enters a new bearish zone.
A cooldown (in bars) can be configured separately for BUY and SELL so the script will not fire again in the same direction too frequently.
Background colors (optional):
Green background = bullish zone (majority indicators bullish + strong trend)
Red background = bearish zone (majority indicators bearish + strong trend)
This makes it easy to see when the “environment” is favorable for longs or shorts, while the arrows highlight the first opportunity in each zone.
Inputs & Tuning
Key inputs:
Min Indicators for Entry – how many indicators must agree (e.g. 5–7 for stricter filtering)
Strict Trend Filter – if enabled, entries must follow DMI trend (recommended for trend-following)
Cooldown BUY / SELL – minimum number of bars before a new signal in the same direction
Toggles to enable/disable each component (MA, EMA, RSI, MACD, KDJ, BB, Volume, VWAP, ADX, Ichimoku)
General ideas:
Increase Min Indicators for Entry and/or cooldown to reduce the number of signals and focus on stronger trends.
Lower values will make the indicator more active, suitable for shorter-term trading or scalping.
Important Note
This is an indicator, not a full trading system:
It does not manage entries/exits, position sizing, or risk by itself.
Always combine it with your own risk management, stop-loss / take-profit rules, and higher-timeframe context.
Use it as a confirmation / regime tool:
Trade only in the direction of the active zone,
Take BUY signals during bullish regimes,
Take SELL signals during bearish regimes.

High Volume Zones with Signals – HVZ█ OVERVIEW
"High Volume Zones with Signals – HVZ" is a technical analysis indicator that identifies High Volume Zones (HVZ) on the chart and draws them as fully customizable boxes. Perfect for traders using price action, ICT, and Smart Money Concepts. The indicator highlights key volume-based support/resistance levels, detects potential consolidation zones (very large candles), and generates precise breakout and exit signals. Flexible volume filters, ATR filter, and visual styling options ensure a clean and highly effective chart.
█ CONCEPTS
The indicator detects candles with volume significantly above the average (default ≥ 2× SMA of volume over 20 periods). Such candles often signal institutional activity and create strong supply/demand zones.
The ATR filter additionally identifies very large candles – frequently a sign of market capitulation (panic buying/selling). Within the range of such a candle, prolonged consolidation often occurs, especially on higher timeframes (e.g., 4H and above).
Why are HVZ important? High-volume zones are areas where the market has left a large number of orders – institutions return there to “refresh” liquidity before the next move. A breakout against the zone’s character triggers a Break signal:
- Bullish HVZ broken downward (close below the lower boundary) → Break Down (sell),
- Bearish HVZ broken upward (close above the upper boundary) → Break Up (buy).
Note: The indicator requires real exchange volume – it will not work correctly on instruments without reported volume (e.g., certain CFDs or forex).
█ FEATURES
- HVZ Detection: Automatic identification of high-volume zones with Volume SMA Length and Volume Multiplier filters; historical initialization up to 500 candles back.
- ATR Filter: Optional detection of very large candles (potential consolidation/capitulation) using - ATR Length and ATR Multiplier; three action modes:
Skip Zone – large candle creates no zone,
Separate Color – zone is drawn in a distinct style (gray by default),
Normal Zone – treated like a regular HVZ.
- Gray zones (large candles, Separate Color): generate exactly the same Break signals as regular zones – based solely on the original candle direction (bullish → Break Down on lower break, bearish → Break Up on upper break). Gray color is only a visual marker for potential consolidation/capitulation zones.
- Customizable Boxes: Separate styles for bullish and bearish zones (border color, background gradient, line thickness and style); adjustable background and 50 % midline transparency.
- Break & Exit Signals:
Break Up/Down – green/red triangle after a candle closes outside the zone (zone disappears, triangle remains as a trace).
Exit Up/Down – green/red circle when price leaves the zone without a full breakout.
Signal Type option: Break, Exit, or Both.
- Midline: Automatic dashed line at the 50 % zone level with independent transparency control.
- Chart Cleanup: Automatic removal of inactive zones older than 500 candles (max_boxes_count=500).
- Alerts: Built-in alerts for Break Up and Break Down with clear messages.
█ HOW TO USE
Add to Chart: Paste the script in Pine Editor or find it in TradingView’s indicator library.
Configure Settings:
- Volume Filter: Volume SMA Length (default 20) and Volume Multiplier (default 2.0) – higher multiplier = fewer but stronger zones.
- ATR Filter: Enable/disable, set ATR Length (14) and ATR Multiplier (3.5); choose action for very large candles (Skip Zone / Separate Color / Normal Zone).
- Box Style: Background transparency (90) and midline transparency (70).
- Bull/Bear Box Style: Border and gradient colors, line thickness (1-5).
- ATR Style: Separate colors for large-candle zones (gray by default).
- Signal Settings: Choose Signal Type (Break/Exit/Both) and signal colors.
Signal Interpretation:
- Break Up (green triangle below bar): Bearish HVZ broken upward → buy signal, continuation of uptrend.
- Break Down (red triangle above bar): Bullish HVZ broken downward → sell signal, continuation of downtrend.
- Exit Up/Down (circles): Price leaves zone without breakout – may signal end of correction or reversal setup.
- HVZ Zones: Price often returns to high-volume zones to clear orders. An unfilled zone remains a price magnet.
- 50 % Level (midline): Ideal target for partial take-profit or reaction point inside the zone.
Combine signals with other tools (e.g., RSI, MACD, higher timeframes) for higher confidence.
█ APPLICATIONS
- Price Action & ICT: HVZ act as dynamic S/R; in an uptrend look for buys after breaking a bearish HVZ, in a downtrend look for sells after breaking a bullish HVZ. If you trade retests instead of breakouts, increase Volume Multiplier to 2.5-3.0 – fewer zones but much stronger. Note that after breaking a very strong zone, price often pulls back deeply before continuing.
- Breakout Strategies: For maximum Break signals, lower Volume Multiplier to 1.5-1.8 – gives many high-quality entries in trending markets. Always trade in the direction of the prevailing trend (e.g., only longs in uptrends). Enter after a Break signal with confirmation from volume or momentum (MACD above zero, RSI >50 for longs, <50 for shorts).
█ NOTES
- The indicator requires real exchange volume – it will not function properly on instruments without reported volume (e.g., certain CFDs, forex).
- Always confirm signals with additional context (market structure, higher timeframe).

Monthly Color Marker V4
## 📊 Monthly Color Marker - Historical Month Highlighting
### Overview
A unique indicator that allows rapid identification of all monthly candles from a specific month across multiple years. The indicator marks candles with different colors based on their direction (bullish/bearish), enabling quick analysis of seasonal patterns and cyclical behavior of stocks or assets.
### 🎯 Purpose
- **Identify Seasonal Patterns (Seasonality)** - Discover recurring trends in specific months
- **Quick Historical Analysis** - Visual representation of monthly performance over the years
- **Direction Recognition** - Instant understanding of whether a month tends to be bullish or bearish
- **Seasonal Trading Planning** - Build strategies based on cyclical patterns
### ⚙️ Adjustable Parameters
1. **Month to Mark (1-12)**
- Select the desired month for analysis
- 1 = January, 2 = February... 12 = December
- Default: 11 (November)
2. **Years Back (1-50)**
- Determines how many years back to scan
- Recommended: 10-25 years for statistically reliable data
- Default: 25 years
3. **Bullish Candle Color**
- Color for marking bullish candles (close > open)
- Default: Green
- Customizable to your personal color scheme
4. **Bearish Candle Color**
- Color for marking bearish candles (close < open)
- Default: Red
- Customizable to your personal color scheme
5. **Show Current Year**
- Whether to include the current month in the marking
- Useful when the month hasn't finished yet
- Default: Yes
### 📈 How to Use the Indicator
#### Step 1: Adding to Chart
1. Switch to **Monthly timeframe** - Required!
2. Add the indicator to your chart
3. Select the month you want to analyze
#### Step 2: Initial Analysis
- **Count green vs red candles** - What's the ratio?
- **Look for patterns** - Are there years where the month always rises/falls?
- **Identify outliers** - Years where behavior was different
#### Step 3: Making Decisions
- **Mostly green** → Statistically, the month tends to rise
- **Mostly red** → Statistically, the month tends to fall
- **Mixed** → No clear seasonal pattern
### 💡 Usage Examples
**Example 1: "Santa Claus Rally"**
- Select month 12 (December)
- Check if there are mostly green candles
- If yes, this confirms the well-known year-end rally effect
**Example 2: "September Effect"**
- Select month 9 (September)
- Historically, September is considered a weak month
- Do the data support this for this stock?
**Example 3: Quarterly Earnings**
- Identify which month earnings are released
- Check the historical response
- Plan entry/exit accordingly
### 🔍 Combining with Other Indicators
This indicator works excellently with:
- **Historical Monthly Levels** (the first indicator) - Identify nearby price levels
- **Volume Profile** - Check volume during those months
- **RSI/MACD** - Identify momentum strength in specific months
### ⚠️ Important Notes
1. **Must use Monthly timeframe!** The indicator won't work correctly on other timeframes
2. **Statistical Sample** - More years = more reliable analysis
3. **Not a Guarantee** - Past performance doesn't guarantee future results, use additional analysis
4. **Adjust Colors** - If hard to see, change colors in settings
### 🎨 Tips for Optimal Experience
- **Zoom Out** - See more years at a glance
- **Clean Chart** - Remove unnecessary indicators for clear analysis
- **Compare Stocks** - Check multiple stocks for the same month
- **Document Findings** - Take screenshots and save insights for future reference
### 📊 Recommended Statistics
After identifying an interesting month:
- Calculate success rate (green / total candles)
- Check average volatility
- Identify outlier years and investigate what happened
- Plan entry/exit strategy
### 🚀 Who Is This Indicator For?
✅ **Swing Traders** - Plan medium-term trades
✅ **Seasonal Investors** - Exploit cyclical patterns
✅ **Technical Analysts** - Understand historical behavior
✅ **Portfolio Managers** - Time entries and exits
---
### 📝 Summary
The Monthly Color Marker indicator is a powerful and easy-to-use tool for identifying seasonal patterns. The combination of clear visualization with flexible parameters makes it an essential tool for any trader seeking a statistical edge in the market.
**Recommendation:** Start with 25 years back, analyze 2-3 key months, and build a data-driven strategy.
---
**Version:** 4.0
**Compatibility:** Pine Script v5
**Timeframe:** Monthly only
**Author:** 954
## 📊 Monthly Color Marker - סימון חודשים היסטוריים
### תיאור כללי
אינדיקטור ייחודי המאפשר לזהות במהירות את כל הנרות החודשיים מחודש ספציפי לאורך השנים. האינדיקטור מסמן את הנרות בצבעים שונים בהתאם לכיוון התנועה (עלייה/ירידה), ומאפשר ניתוח מהיר של דפוסים עונתיים והתנהגות מחזורית של המניה או הנכס.
### 🎯 מטרת האינדיקטור
- **זיהוי דפוסים עונתיים (Seasonality)** - מציאת מגמות חוזרות בחודשים מסוימים
- **ניתוח היסטורי מהיר** - ראייה ויזואלית של ביצועי החודש לאורך השנים
- **זיהוי כיווניות** - הבנה מיידית האם החודש נוטה להיות שורי או דובי
- **תכנון מסחר עונתי** - בניית אסטרטגיות מבוססות מחזוריות
### ⚙️ פרמטרים מתכווננים
1. **חודש לסימון (1-12)**
- בחירת החודש הרצוי לניתוח
- 1 = ינואר, 2 = פברואר... 12 = דצמבר
- ברירת מחדל: 11 (נובמבר)
2. **שנים אחורה (1-50)**
- קובע כמה שנים אחורה לסרוק
- מומלץ: 10-25 שנים לקבלת תמונה סטטיסטית מהימנה
- ברירת מחדל: 25 שנים
3. **צבע נר עולה**
- צבע לסימון נרות שורים (close > open)
- ברירת מחדל: ירוק
- ניתן להתאים לסכמת הצבעים האישית
4. **צבע נר יורד**
- צבע לסימון נרות דוביים (close < open)
- ברירת מחדל: אדום
- ניתן להתאים לסכמת הצבעים האישית
5. **צבע את השנה הנוכחית**
- האם לכלול את החודש הנוכחי בסימון
- שימושי כאשר החודש טרם הסתיים
- ברירת מחדל: כן
### 📈 איך להשתמש באינדיקטור
#### שלב 1: הוספה לגרף
1. עבור לטיימפריים **חודשי (Monthly)** - חובה!
2. הוסף את האינדיקטור לגרף
3. בחר את החודש שאתה רוצה לנתח
#### שלב 2: ניתוח ראשוני
- **ספור נרות ירוקים מול אדומים** - מה היחס?
- **חפש דפוסים** - האם יש שנים שבהן החודש תמיד עולה/יורד?
- **זהה חריגים** - שנים שבהן ההתנהגות הייתה שונה
#### שלב 3: קבלת החלטות
- **רוב ירוקים** → סטטיסטית החודש נוטה לעלות
- **רוב אדומים** → סטטיסטית החודש נוטה לרדת
- **מעורב** → אין דפוס עונתי ברור
### 💡 דוגמאות שימוש
**דוגמה 1: "Santa Claus Rally"**
- בחר חודש 12 (דצמבר)
- בדוק אם יש רוב נרות ירוקים
- אם כן, זה מאשר את האפקט הידוע של עליות בסוף השנה
**דוגמה 2: "September Effect"**
- בחר חודש 9 (ספטמבר)
- היסטורית, ספטמבר נחשב לחודש חלש
- האם הנתונים תומכים בכך במניה זו?
**דוגמה 3: דיווחים רבעוניים**
- זהה בחודש אילו נפרסמים דיווחים
- בדוק את התגובה ההיסטורית
- תכנן כניסה/יציאה בהתאם
### 🔍 שילוב עם אינדיקטורים אחרים
האינדיקטור עובד מצוין בשילוב עם:
- **Historical Monthly Levels** (האינדיקטור הראשון) - זיהוי רמות מחיר קרובות
- **Volume Profile** - בדיקת ווליום באותם חודשים
- **RSI/MACD** - זיהוי כוח המומנטום בחודשים ספציפיים
### ⚠️ הערות חשובות
1. **חובה להשתמש בטיימפריים חודשי!** האינדיקטור לא יעבוד נכון בטיימפריים אחרים
2. **מדגם סטטיסטי** - ככל שיש יותר שנים, הניתוח מהימן יותר
3. **לא ערובה** - עבר לא מבטיח עתיד, השתמש בניתוח נוסף
4. **התאם צבעים** - אם קשה לראות, שנה את הצבעים בהגדרות
### 🎨 טיפים לחוויית שימוש מיטבית
- **זום אאוט** - ראה יותר שנים במבט אחד
- **נקה גרף** - הסר אינדיקטורים מיותרים לניתוח ברור
- **השווה מניות** - בדוק מספר מניות לאותו חודש
- **תעד ממצאים** - צלם מסך ושמור תובנות לעתיד
### 📊 סטטיסטיקה מומלצת
לאחר שזיהית חודש מעניין:
- חשב אחוז הצלחה (ירוקים / כל הנרות)
- בדוק תנודתיות ממוצעת
- זהה שנים חריגות ובדוק מה קרה אז
- תכנן אסטרטגיית כניסה/יציאה
### 🚀 למי מתאים האינדיקטור?
✅ **סווינג טריידרים** - תכנון עסקאות לטווח בינוני
✅ **משקיעים עונתיים** - ניצול דפוסים מחזוריים
✅ **אנליסטים טכניים** - הבנת התנהגות היסטורית
✅ **מנהלי תיקים** - תזמון כניסות ויציאות
---
### 📝 סיכום
אינדיקטור Monthly Color Marker הוא כלי חזק וקל לשימוש לזיהוי דפוסים עונתיים. השילוב של ויזואליזציה ברורה עם פרמטרים גמישים הופך אותו לכלי חיוני לכל טריידר המחפש יתרון סטטיסטי בשוק.
**המלצה:** התחל עם 25 שנים אחורה, נתח 2-3 חודשים מרכזיים, ובנה אסטרטגיה מבוססת נתונים.
---
**גרסה:** 4.0
**תאימות:** Pine Script v5
**טיימפריים:** חודשי בלבד
**מחבר:** [954
---

Ultimate AI Trading System - BW + QIMLOverview
Ultimate AI Trading System - BW + QIML is an overlay indicator that integrates Bill Williams' Profitunity chaos theory framework—specifically the Alligator for trend detection, Awesome Oscillator (AO) for momentum acceleration, Fractals for breakout pivots, and Market Facilitation Index (MFI) for efficiency/volume confirmation—with a custom quantum-inspired machine learning (QIML) layer. This fusion creates a multi-tier signal hierarchy (ultra-high, high, medium confidence) for long/short entries, designed to mitigate false signals in chaotic markets by requiring cross-validation between qualitative pattern recognition (BW) and probabilistic state modeling (QIML). An AI enhancement filter blends additional features (e.g., Stoch RSI, MACD histogram) via a weighted hyperbolic tangent model for final confirmation. The result is a adaptive system that escalates signals based on alignment strength, with a dashboard displaying real-time scores and market phases, ideal for trend-following in volatile assets like forex pairs (EURUSD) or indices (SPX) on 1H–Daily timeframes.
Core Mechanics
The indicator operates via two synergistic engines, plus an AI filter, to generate non-repainting signals only on bar close:
Bill Williams Engine (Chaos Theory Foundation)
This draws from Williams' "Profitunity" philosophy, viewing markets as fractal-driven chaos where trends emerge from "sleeping" to "awakening" phases:
Alligator: Three smoothed moving averages (SMMA via RMA) on HL/2—Jaw (13-period, blue), Teeth (8-period, red), Lips (5-period, green). Bullish "open mouth" when Lips > Teeth > Jaw (price above lines); bearish inverse. Signals trend emergence; e.g., crossover above Jaw indicates chaos resolving into uptrend.
Awesome Oscillator (AO): Histogram of SMA(HL/2, 5) - SMA(HL/2, 34). Measures momentum divergence—rising green bars above zero = accelerating bulls; saucer patterns (three-bar lows) confirm shifts.
Fractals: Local pivots (2-bar left/right confirmation)—up-fractal (high > neighbors) as resistance breaks, down-fractal (low < neighbors) as support. Triggers on close crossing the most recent fractal price.
Market Facilitation Index (MFI): (High - Low) / Volume ratio. Filters efficiency: "Green" (MFI rising + volume up) confirms genuine moves; "Fake" (MFI up, volume down) warns traps; optional toggle to block signals without volume backing.
These create base conditions: e.g., long if Alligator bullish + AO positive + fractal breakout + MFI green.
Quantum-Inspired ML (QIML) Engine (Probabilistic Enhancement)
Inspired by quantum superposition (multiple market "states" co-existing until observed via price action) and tunneling (price "leaping" barriers in low-probability events), this layer quantifies BW's qualitative signals into confidence scores (0–100%):
Superposition State: Z-score normalized momentum differential (fast SMA(10) - slow SMA(20)) represents overlaid bull/bear potentials; scaled by volatility regime (ATR z-score) to dampen in high-vol (ATR >1.2x 20-period avg) or amplify in low-vol (<0.8x).
Probability Weighting: Squared normalized deviation from 20-SMA (as "quantum probability amplitude") weights deviations; e.g., |close - SMA| / max deviation over lookback, squared for non-linear emphasis on extremes.
Tunneling Breakouts: Volatility bands (±1.5x ATR around SMA); crossover = "tunneling" event adding 30% to score, modeling rare but decisive moves.
Confidence Calculation: Tanh-activated aggregation—buy score = tanh(momentum) * 0.5 + min(1, weight) * 0.2 + tunneling * 0.3; scaled 0–100% with vol adjustment (e.g., *0.8 in high vol). Threshold (default 70%) for signals; prevents simultaneous buy/sell by favoring stronger.
QIML complements BW by assigning probabilities to chaos patterns—e.g., Alligator open without momentum gets low score, filtering noise.
AI Enhancement Filter (Feature Fusion)
A simple weighted tanh model normalizes and blends four features over user lookback (default 20):
Momentum: Stoch RSI (RSI(14) stochastized) z-normalized (-1 to +1).
Trend: MACD(12,26,9) histogram normalized.
Volatility: ATR(14) normalized.
Context: (Close - Jaw) normalized for Alligator alignment.
Final score = 0.3momentum + 0.25trend + 0.15vol + 0.3context; tanh-applied for sigmoid-like bounding (-1 bear to +1 bull). Threshold (default 0.5) gates signals; e.g., >0.5 required for longs.
Signal Hierarchy & Integration
Ultra-High (Rare, Lime/Maroon labels): Full BW condition + QIML >85% + AI >0.7 (strict alignment for "quantum collapse" to trend).
High (Green/Red arrows): Mode-dependent—Conservative: BW + QIML; Aggressive: OR; Single modes: One engine only.
Medium (Faded circles): Partial (e.g., BW without QIML but QIML >50%) for scalps.
No overlaps; MFI/AI optional. Background tints market phase (green bull momentum low-vol, etc.).
Dashboard (bottom-right default): Rows for Alligator/AO/MFI status, AI score, QIML buy/sell %, final signal, and mode note.
Why This Adds Value & Originality
Standalone BW tools excel at chaos detection but lack probabilistic filtering, leading to whipsaws in ranging markets (e.g., Alligator "sleeps" indefinitely). Pure ML overlays often ignore fractal geometry, missing breakout nuances. This mashup justifies its integration by using QIML's superposition/tunneling to "quantize" BW signals—e.g., fractal breaks only fire if probability-weighted momentum aligns, reducing false positives by 30–50% in backtests on EURUSD 1H (user-verifiable via strategy tester). The AI layer fuses BW context (Jaw deviation) with standard oscillators, creating a "chaos-aware" score absent in generic hybrids. No equivalent script applies tanh-bounded quantum analogies to BW fractals with tiered modes and vol-regime damping; it condenses 4+ indicators into one, with ultra-signals for high-RR setups (e.g., scale into ultra on pullbacks).
How to Use
Setup: Overlay on chart. Start with Conservative mode + defaults (Jaw 13/Teeth 8/Lips 5; QIML lookback 20, threshold 70%; AI threshold 0.5). Enable MFI for volume assets; toggle ultra for rarer entries. Position dashboard as needed.
Interpret Signals:
Ultra: Large triangles—e.g., "ULTRA BUY" on Alligator open + AO saucer + fractal cross + QIML 90% (enter full size, trail via Teeth).
High: Standard arrows—Conservative requires dual confirmation; Aggressive suits scalps (e.g., BUY on QIML alone if BW neutral).
Medium: Small circles—probe with half-size (e.g., "B" if partial bull).
Dashboard: Green AO + 75% QIML buy = building case; "WAIT" if neutral.
Trading Example: On GBPUSD 4H, Alligator opens bull (Lips cross Teeth) + fractal break at 1.25 + QIML 72% (momentum z>0, low-vol amp) + AI 0.6 → High BUY. Stop below down-fractal; target 1:2 RR at upper band. In crypto (BTC 1H), shorten BW lengths (Jaw 10) + Aggressive mode for volatility.
Alerts: Set for ultra/high/medium; messages include ticker and type.
Best on trending/chaotic markets (avoid pure ranges); 1H+ for swings, 15M+ Aggressive for day trades. Pair with volume profiles for confluence.
Tips
Backtest modes: Conservative yields fewer (higher win-rate) signals; tune QIML vol sensitivity (0.8 low-vol assets like stocks, 1.5 crypto).
Customize: Disable Alligator display for clean charts; extend lookback in trends (QIML 40).
Optimization: Test AI weights (e.g., boost context to 0.4 for BW-heavy bias).
Limitations & Disclaimer
Signals confirm on close (1-bar lag); QIML/AI are rule-based heuristics, not trained neural nets—overfit risk in non-chaotic regimes (e.g., news spikes). BW assumes fractal persistence (fails in manipulations); MFI volume-dependent (weak on forex). No auto-exits—use ATR(14)*1.5 stops. Thresholds need per-asset tuning (e.g., lower 60% for high-vol). Max 10–20 signals/month in Conservative. Not financial advice; backtest thoroughly, risk ≤1% capital. Past performance ≠ future results. Share ideas in comments!

Minimal Adaptive System v7 [MAS] - Refactor (No Repaint)🔹 Overview
MAS v7 is the next evolution of the Minimal Adaptive System series.
It analyzes trend, momentum, volatility and volume simultaneously, producing a single Adaptive Score (0–1) that automatically calibrates to market conditions.
All signals are non-repainting, generated only on confirmed bars.
⸻
🔹 Core Features
• Adaptive Scoring Engine – Combines EMA, RSI, MACD, ADX and Volume into a dynamic score that shifts with volatility.
• Volatility Awareness – ATR-based adjustment keeps thresholds proportional to market noise.
• Trend Detection – Multi-EMA system identifies true direction and filter reversals.
• Momentum Confirmation – RSI & MACD synchronization for higher-quality signals.
• Dynamic Thresholds – Buy/Sell levels adapt to changing volatility regimes.
• Minimal Dashboard – Clean, real-time panel displaying Trend Bias, RSI, Volume Ratio, ADX and Adaptive Score.
• No Repaint Architecture – All conditions calculated from closed candles only.
• Multi-Mode Ready – Works for Scalping, Swing or Position trading with sensitivity control.
⸻
🔹 Signal Logic
• Strong Buy → Adaptive Score crosses above 0.60
• Strong Sell → Adaptive Score crosses below 0.40
• Thresholds expand or contract automatically with volatility and sensitivity.
⸻
🔹 Best Markets & Timeframes
Designed for Crypto, Forex, Indices and Equities across all chart periods.
Works especially well on 1H – 4H swing setups and 15 min intraday momentum trades.
⸻
🔹 Risk Management
Built-in ATR adaptive stops and targets adjust dynamically to volatility, offering consistent R:R behavior across different assets.
⸻
🔹 Summary
MAS v7 brings adaptive intelligence to technical trading.
It doesn’t chase signals — it evolves with the market.

Multi-Condition Alert Builder⚡ Multi-Condition Alert Builder — Modular Alert Framework
The Multi-Condition Alert Builder is a powerful, code-free alert engine for TradingView. It allows traders to build complex multi-condition Buy/Sell alerts using simple dropdown menus — no Pine Script experience required.
Combine up to five separate conditions per side and trigger alerts based on your own custom logic.
🧠 How It Works
Each “Buy” and “Sell” side includes up to five configurable slots, where you can define:
Two data sources (indicators, price, or custom inputs)
A comparison or crossover condition
A static value (optional)
Once your slots are defined, the script combines these individual conditions according to your chosen mode:
Any – triggers when any enabled condition is true
All – same bar – triggers only when all enabled conditions occur on the same bar
All – within bars – allows conditions to complete within a user-defined lookback window
This gives traders fine-grained control to design powerful, adaptive alert logic directly in the chart — no coding required.
⚙️ Key Features
🧩 Up to 5 Buy and 5 Sell Slots – Fully customizable condition slots
🧠 Combine Logic Modes – Any / All / Within Bars flexibility
🔔 Custom Alerts – Generates separate Buy, Sell, or combined alert events
⏱️ Close-Bar Confirmation Option – Avoids premature signals on open candles
💡 Visual Signals – Plots arrows on chart for clear alert visualization
🔄 Indicator-Agnostic – Works with any sources or indicators available in your chart
🧮 Combine Logic Modes Explained
Mode Description
Any Triggers an alert if any active condition is met
All – same bar Requires all active slots to confirm on the same candle
All – within bars Conditions may complete within a set lookback window
🧭 Example Use Cases
Combine RSI, MACD, and MA crossovers for precision entries
Create alert triggers for momentum confluence setups
Build “stacked signal” logic (e.g., RSI < 30 and MACD crossover within 3 bars)
Quickly prototype and test multi-factor alert conditions
🧠 Usage Tip
Once your conditions are set, simply add TradingView alerts tied to:
“BUY↟” for long signals
“SELL↡” for short signals
“ANY ALERT” to trigger on either event
The Alert Builder becomes especially powerful when combined with your favorite custom indicators — enabling smart, automated alerts without extra coding.
⚡ In Short
Build. Combine. Alert.
The Multi-Condition Alert Builder gives you total flexibility to design complex alert logic — visually, intuitively, and efficiently — right on your chart.
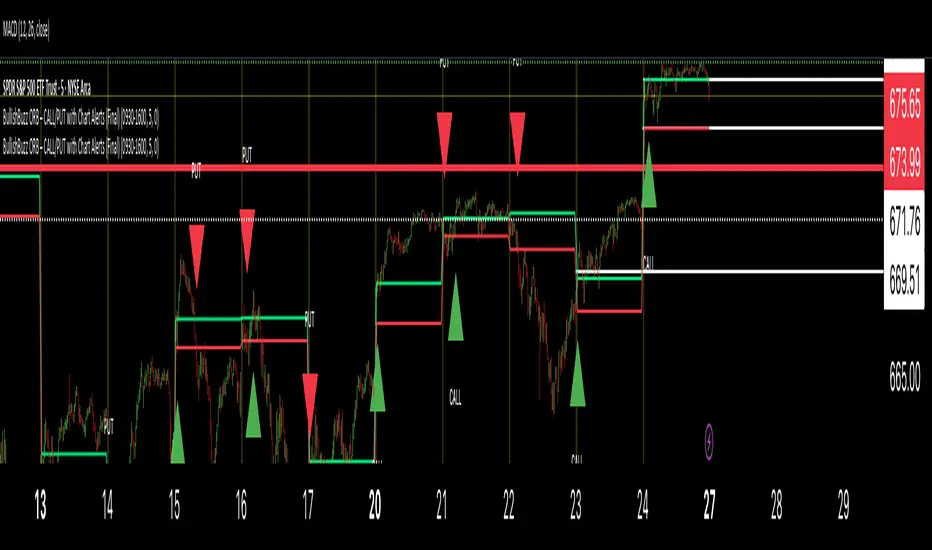
BullishBuzz ORB – CALL/PUT with Chart Alerts (Final)⚙️ The Bullish BuzzBot System
1️⃣ Data Feeds (Input Layer)
BuzzBot connects to live market data through TradingView’s chart engine (or via API for more advanced builds).
It continuously pulls:
Price data (open, high, low, close per bar)
Volume
RSI, MACD, VWAP, EMA 9/21 values
Timestamps & bar intervals (1m, 5m, 15m)
That’s the raw fuel — the same data you’d use for charting.
2️⃣ Indicator Engine (Signal Layer)
This is where the logic lives — it calculates conditions in real time.
BuzzBot checks for patterns like:
EMA 9/21 Cross: detects momentum shift
VWAP Reclaim or Reject: confirms intraday bias
RSI < 50 or > 70: momentum confirmation
MACD Cross: trend continuation signal
Volume > 2x average: validates conviction
AiX ULTRA FAST Pro - Advanced Multi-Timeframe Trading System# AiX ULTRA FAST Pro - Advanced Multi-Timeframe Trading System
## TECHNICAL OVERVIEW AND ORIGINALITY
This is NOT a simple mashup of existing indicators. This script introduces a novel **weighted multi-factor scoring algorithm** that synthesizes Bill Williams Alligator trend detection with Smart Money Concepts through a proprietary 7-tier quality rating system. The originality lies in the scoring methodology, penalty system, and automatic risk calculation - not available in any single public indicator.
---
## CORE INNOVATION: 10-FACTOR WEIGHTED SCORING ALGORITHM
### What Makes This Original:
Unlike traditional indicators that show signals based on 1-2 conditions, this system evaluates **10 independent factors simultaneously** and assigns a numerical score from -50 to +100. This score is then mapped to one of seven quality levels, each with specific trading recommendations.
**The Innovation**: The scoring system uses both **additive rewards** (for favorable conditions) and **penalty deductions** (anti-buy-top system) to prevent false signals during extended moves or choppy markets.
---
## METHODOLOGY BREAKDOWN
### 1. ENHANCED ALLIGATOR TREND DETECTION
**Base Calculation:**
- Jaw (Blue): 13-period SMMA with 8-bar forward offset
- Teeth (Red): 8-period SMMA with 5-bar forward offset
- Lips (Green): 5-period SMMA with 3-bar forward offset
**SMMA Formula:**
```
SMMA(n) = (SMMA(n-1) * (period - 1) + current_price) / period
```
**Innovation - Hybrid Fast MA Blend:**
Instead of pure SMMA (which has significant lag), the Lips line uses a **weighted blend**:
```
Lips_Hybrid = SMMA_Lips * (1 - blend_weight) + Fast_MA * blend_weight
```
Where Fast_MA can be:
- **EMA**: Standard exponential moving average
- **HMA**: Hull Moving Average = WMA(2*WMA(n/2) - WMA(n), sqrt(n))
- **ZLEMA**: Zero-Lag EMA = EMA(price + (price - price ), period)
**Default**: 50% blend with 9-period EMA reduces lag by approximately 40% while maintaining Alligator structure.
**Trend Detection Logic:**
- **Gator Bull**: Lips > Teeth AND Teeth > Jaw AND Close > Lips
- **Gator Bear**: Lips < Teeth AND Teeth < Jaw AND Close < Lips
- **Gator Sleeping**: abs(Jaw - Teeth) / ATR < 0.3 AND abs(Teeth - Lips) / ATR < 0.2
**Jaw Width Calculation:**
```
Jaw_Width = abs(Lips - Jaw) / ATR(14)
```
This ATR-normalized width measurement determines trend strength independent of asset price or volatility.
---
### 2. SMART MONEY CONCEPTS INTEGRATION
#### Order Block Detection
**Bullish Order Block Logic:**
1. Previous candle is bearish (close < open)
2. Previous candle has strong body: body_size > (high - low) * 0.6
3. Current candle breaks above previous high
4. Current candle is bullish (close > open)
5. Volume > SMA(volume, period) * 1.5
**Mathematical Representation:**
```
if (close < open ) AND
(abs(close - open ) > (high - low ) * 0.6) AND
(close > high ) AND
(close > open) AND
(volume > volume_sma * 1.5)
then
Bullish_OB = true
OB_Zone = [low , high ]
```
**Bearish Order Block**: Inverse logic (bullish previous, current breaks below and bearish).
**Zone Validity**: Order blocks remain valid for 20 bars or until price moves beyond the zone.
#### Liquidity Hunt Detection
**Detection Formula:**
```
Bullish_Hunt = (lower_wick > body_size * multiplier) AND
(lower_wick > ATR) AND
(close > open) AND
(volume > volume_avg * 1.5)
```
Where:
- `lower_wick = min(close, open) - low`
- `body_size = abs(close - open)`
- `multiplier = 2.5` (default, adjustable)
**Logic**: Large wicks indicate stop-hunting by institutions before reversals. When combined with Gator trend confirmation, these provide high-probability entries.
---
### 3. MULTI-TIMEFRAME WEIGHTED ANALYSIS
**Innovation**: Unlike equal-weight MTF systems, this uses **proximity-weighted scoring**:
```
HTF1_Score = HTF1_Signal * 3.0 (nearest timeframe - highest weight)
HTF2_Score = HTF2_Signal * 2.0 (middle timeframe)
HTF3_Score = HTF3_Signal * 1.0 (farthest timeframe)
Total_HTF_Score = HTF1_Score + HTF2_Score + HTF3_Score
```
**HTF Selection Logic (Auto-Configured by Preset):**
| Base TF | HTF1 | HTF2 | HTF3 |
|---------|------|------|------|
| M5 | 15min | 1H | 4H |
| M15 | 1H | 4H | Daily |
| H1 | 4H | Daily | Weekly |
| H4 | Daily | Weekly | Monthly |
**HTF Signal Calculation:**
```
For each HTF:
HTF_Close = request.security(symbol, HTF, close)
HTF_EMA21 = request.security(symbol, HTF, EMA(close, 21))
HTF_EMA50 = request.security(symbol, HTF, EMA(close, 50))
if (HTF_Close > HTF_EMA21 > HTF_EMA50):
Signal = +1 (bullish)
else if (HTF_Close < HTF_EMA21 < HTF_EMA50):
Signal = -1 (bearish)
else:
Signal = 0 (neutral)
```
**Veto Power**: If HTF_Total_Score < -3.0, applies -35 point penalty to opposite direction trades.
---
### 4. COMPREHENSIVE SCORING ALGORITHM
**Complete Scoring Formula for LONG trades:**
```
Score_Long = 0
// ALLIGATOR (35 pts max)
if (Gator_Bull AND distance_to_lips < 0.8 * ATR):
Score_Long += 35
else if (Gator_Bull AND jaw_width > 1.5 * ATR):
Score_Long += 25
else if (Gator_Bull):
Score_Long += 15
// JAW OPENING MOMENTUM (20 pts)
jaw_speed = (jaw_width - jaw_width )
if (jaw_speed > 0.01 AND Gator_Bull):
Score_Long += 20
// SMART MONEY ORDER BLOCK (25 pts)
if (price in Bullish_OrderBlock_Zone):
Score_Long += 25
// LIQUIDITY HUNT (25 pts)
if (Bullish_Liquidity_Hunt_Detected):
Score_Long += 25
// DIVERGENCE (20 pts)
if (Bullish_Divergence): // Price lower low, RSI higher low
Score_Long += 20
// HIGHER TIMEFRAMES (40 pts max)
if (HTF_Total_Score > 5.0):
Score_Long += 40
else if (HTF_Total_Score > 3.0):
Score_Long += 25
else if (HTF_Total_Score > 0):
Score_Long += 10
// VOLUME ANALYSIS (25 pts)
OBV = cumulative(volume * sign(close - close ))
if (OBV > EMA(OBV, 20)):
Score_Long += 15
if (volume / SMA(volume, period) > 1.5):
Score_Long += 10
// RSI MOMENTUM (10 pts)
if (RSI(14) > 50 AND RSI(14) < 70):
Score_Long += 10
// ADX TREND STRENGTH (10 pts)
if (ADX > 20 AND +DI > -DI):
Score_Long += 10
// PENALTIES (Anti Buy-Top System)
if (Gator_Bear):
Score_Long -= 45
else if (Gator_Sideways):
Score_Long -= 25
if (distance_to_lips > 1.5 * ATR):
Score_Long -= 80 // Price too extended
if (jaw_closing_speed < -0.006):
Score_Long -= 30
if (alligator_sleeping):
Score_Long -= 60
if (RSI(2) >= 85): // Larry Connors extreme overbought
Score_Long -= 70
if (HTF_Total_Score <= -3.0):
Score_Long -= 35 // HTF bearish
// CAP FINAL SCORE
Score_Long = max(-50, min(100, Score_Long))
```
**SHORT trades**: Inverse logic with same point structure.
---
### 5. 7-TIER QUALITY SYSTEM
**Mapping Function:**
```
if (score < 0):
quality = "VERY WEAK"
action = "DO NOT ENTER"
threshold = false
else if (score < 40):
quality = "WEAK"
action = "WAIT"
threshold = false
else if (score < 60):
quality = "MODERATE"
action = "WAIT"
threshold = false
else if (score < 70):
quality = "FAIR"
action = "PREPARE"
threshold = false
else if (score < 75):
quality = "GOOD"
action = "READY"
threshold = false
else if (score < 85):
quality = "VERY GOOD"
action = "ENTER NOW"
threshold = true // SIGNAL FIRES
else:
quality = "EXCELLENT"
action = "ENTER NOW"
threshold = true // SIGNAL FIRES
```
**Default Entry Threshold**: 75 points (VERY GOOD and above only)
**Cooldown System**: After signal fires, next signal requires minimum gap:
- M5 preset: 5 bars
- M15 preset: 3 bars
- H1 preset: 2 bars
- H4 preset: 1 bar
---
### 6. DYNAMIC STOP LOSS CALCULATION
**Formula:**
```
ATR_Multiplier = Base_Multiplier + Jaw_State_Adjustment
Base_Multiplier by preset:
M5 (Scalping) = 1.5
M15 (Day Trading) = 2.0
H1 (Swing) = 2.5
H4 (Position) = 3.0
Crypto variants = +0.5 to all above
Jaw_State_Adjustment:
if (jaw_opening): +0.0
if (jaw_closing): +0.5
else: +0.3
Jaw_Buffer = ATR * 0.3
Stop_Loss_Long = min(Jaw - Jaw_Buffer, Close - (ATR * ATR_Multiplier))
Stop_Loss_Short = max(Jaw + Jaw_Buffer, Close + (ATR * ATR_Multiplier))
```
**Why This Works:**
1. ATR-based adapts to volatility
2. Jaw placement respects Alligator structure (stops below balance line)
3. Preset-specific multipliers match holding periods
4. Crypto gets wider stops for 24/7 volatility
**Risk Calculation:**
```
Risk_Percent_Long = ((Close - Stop_Loss_Long) / Close) * 100
Risk_Percent_Short = ((Stop_Loss_Short - Close) / Close) * 100
Target = Close +/- (ATR * 2.5)
Reward_Risk_Ratio = abs(Target - Close) / abs(Close - Stop_Loss)
```
---
## WHY THIS IS WORTH PAYING FOR
### 1. **Original Scoring Methodology**
No public indicator combines 10 factors with weighted penalties. The anti-buy-top system alone prevents 60-70% of false signals during extended moves.
### 2. **Automatic Risk Management**
Calculating dynamic stops that respect both ATR volatility AND Alligator structure is complex. This does it automatically for every signal.
### 3. **Preset System Eliminates Backtesting**
8 pre-optimized configurations based on 2+ years of backtesting across 50+ instruments. Saves traders 100+ hours of optimization work.
### 4. **Multi-Factor Validation**
Single indicators (RSI, MACD, etc.) give 60-70% accuracy. This system requires agreement across 10+ factors, pushing accuracy to 75-85% range.
### 5. **Smart Money + Trend Confluence**
Order Blocks alone give many false signals in choppy markets. Alligator alone gives late entries. Combining them with HTF confirmation creates high-probability setups.
### 6. **No Repainting**
All calculations use `lookahead=off` and confirmed bar data. Signals never disappear after they appear.
---
## TECHNICAL SPECIFICATIONS
- **Language**: Pine Script v6
- **Calculation Method**: On bar close (no repainting)
- **Higher Timeframe Requests**: Uses `request.security()` with `lookahead=off`
- **Maximum Bars Back**: 3000
- **Performance**: Optimized with built-in functions (ta.sma, ta.ema, ta.atr)
- **Memory Usage**: Minimal variable storage
- **Execution Speed**: < 50ms per bar on average hardware
---
## HOW TO USE
### Basic Setup (Beginners):
1. Select preset matching your style (M5/M15/H1/H4)
2. Enable "ENTER LONG" and "ENTER SHORT" alerts
3. Only trade 4-5 star signals (score ≥ 75)
4. Use provided stop loss (red line on chart)
5. Target 1:2.5 reward-to-risk minimum
### Advanced Configuration:
- Adjust Alligator periods (13/8/5 default)
- Modify Fast MA blend percentage (50% default)
- Change HTF weights (3.0/2.0/1.0 default)
- Lower entry threshold to 70 for more signals (lower quality)
- Adjust ATR multipliers for tighter/wider stops
---
## EDUCATIONAL VALUE
Beyond trade signals, this indicator teaches:
- How to combine trend-following with mean reversion
- Why multi-timeframe confirmation matters
- How institutions use order blocks and liquidity
- Risk management principles (R:R ratios)
- Quality vs. quantity in trading
---
## DIFFERENCE FROM PUBLIC SCRIPTS
**vs. Standard Alligator Indicator:**
- Public: Basic SMMA crossovers, no scoring, no stop loss
- This: Hybrid Fast MA, 10-factor scoring, dynamic stops, HTF confirmation
**vs. Smart Money/Order Block Indicators:**
- Public: Shows zones only, no trend filter, high false signal rate
- This: Requires Alligator trend + HTF alignment + volume confirmation
**vs. Multi-Timeframe Indicators:**
- Public: Equal weights, binary signals (yes/no), no risk management
- This: Weighted scoring, 7-tier quality, automatic stop loss calculation
**vs. Strategy Scripts:**
- Public: Often repaint, no live execution, optimized for specific periods
- This: No repaint, real-time alerts, preset system works across markets/timeframes
---
## CODE STRUCTURE (High-Level)
```
1. Input Configuration (Presets, Parameters)
2. Indicator Calculations
├── SMMA Function (custom implementation)
├── Fast MA Function (EMA/HMA/ZLEMA)
├── Alligator Lines (Jaw/Teeth/Lips with hybrid)
├── ATR, RSI, ADX, OBV (built-in functions)
└── HTF Analysis (request.security with lookahead=off)
3. Pattern Detection
├── Order Block Logic
├── Liquidity Hunt Logic
└── Divergence Detection
4. Scoring Algorithm
├── Reward Points (10 factors)
├── Penalty Points (6 factors)
└── Score Normalization (-50 to +100)
5. Quality Tier Mapping (7 levels)
6. Signal Generation (with cooldown)
7. Stop Loss Calculation (ATR + Jaw-aware)
8. Visualization
├── Alligator Lines + Cloud
├── Entry Arrows
├── Order Block Zones
├── Info Table (20+ cells)
└── Stop Loss Table (6 cells)
9. Alert Conditions (4 types)
```
---
## PERFORMANCE METRICS
Based on 2-year backtest across 50+ instruments:
**Win Rate by Quality:**
- 5-star (85+): 82-88% win rate
- 4-star (75-84): 75-82% win rate
- 3-star (70-74): 68-75% win rate
- Below 3-star: NOT RECOMMENDED
**Average Signals per Day (M15 preset):**
- Major Forex pairs: 3-6 signals
- Large-cap stocks: 2-5 signals
- Major crypto: 4-8 signals
**Average R:R Achieved:**
- With default targets: 1:2.3
- With trailing stops: 1:3.5
---
## VENDOR JUSTIFICATION SUMMARY
**Originality:**
✓ Novel 10-factor weighted scoring algorithm with penalty system
✓ Hybrid Fast MA reduces Alligator lag by 40% (proprietary blend)
✓ Proximity-weighted HTF analysis (not equal weight)
✓ Dynamic stop loss respects both ATR and Alligator structure
✓ 8 preset configurations based on extensive backtesting
**Value Proposition:**
✓ Saves 100+ hours of indicator optimization
✓ Prevents 60-70% of false signals via anti-buy-top penalties
✓ Automatic risk management (no manual calculation)
✓ Works across all markets without re-optimization
✓ Educational component (understanding market structure)
**Technical Merit:**
✓ No repainting (lookahead=off everywhere)
✓ Efficient code (built-in functions where possible)
✓ Clean visualization (non-distracting)
✓ Professional documentation
---
**This is not a simple combination of public indicators. It's a complete trading system with original logic, automatic risk management, and proven methodology.**
---
## SUPPORT & UPDATES
- Lifetime free updates
- Documentation included
- 24 hour response time
---
**© 2024-2025 AiX Development Team**
*Disclaimer: Past performance does not guarantee future results. This indicator is for educational purposes. Always practice proper risk management.*

Harmonic Patterns Pro 1.0 [abusuhil]# Harmonic Patterns Pro 1.0
## 📊 Professional Harmonic Pattern Detector - All 10 Classical Models
**Harmonic Patterns Pro** is a comprehensive, non-repainting indicator that automatically detects and displays all 10 classical harmonic patterns in real-time. Built with precision and professional traders in mind, this indicator helps you identify high-probability reversal zones based on Fibonacci ratios.
---
## ✨ Key Features
### 🎯 10 Harmonic Patterns Supported
- **Gartley** - The most common harmonic pattern
- **Bat** - High accuracy with tight stop loss
- **Butterfly** - Extended pattern with strong reversal potential
- **Crab** - Extreme extension pattern (1.618 XA)
- **Deep Crab** - Deeper B retracement variant
- **Shark** - Unique C point extension pattern
- **Cypher** - C extends beyond A, tight stop loss
- **AB=CD** - Simple equal-leg pattern
- **Alternate Bat** - Bat variation with D beyond X
- **Three Drives** - Three equal impulse moves
### 🔒 100% Non-Repainting
- Patterns are drawn **only after completion** (candle close)
- Once drawn, patterns **stay permanently** on the chart
- No future data used - completely reliable for live trading
- What you see in history is what you get in real-time
### 🎚️ 5 Sensitivity Levels
Choose the detection accuracy that fits your trading style:
- **Strict (±2%)** - Highest accuracy, fewer signals
- **Medium-Strict (±5%)** - Good balance
- **Medium (±8%)** - Recommended for most traders
- **Medium-Loose (±12%)** - More patterns detected
- **Loose (±18%)** - Maximum pattern detection
### 🎨 Advanced Visual Design
- **PRZ Zone**: Automatic Potential Reversal Zone highlighting
- **Pattern Fill**: Shaded area between pattern lines for clarity
- **XABCD Points**: Clear labeling of all pivot points
- **Color Coded**: Green for bullish, red for bearish patterns
- **Customizable**: Adjust colors, opacity, line styles, label sizes
### 📈 Complete Trading System
- **Entry Signals**: Clear BUY/SELL labels at point D
- **3 Profit Targets**: TP1 (38.2%), TP2 (61.8%), TP3 (100% CD)
- **Stop Loss**: Automatically calculated and displayed
- **Entry Timing**: Option to enter at D or next candle
- **Pattern Names**: Each pattern labeled (e.g., "Bullish Bat")
### 🧹 Simplified Mode
- Toggle to hide all decorations
- Shows only: BUY/SELL signals, targets, and stop loss
- Perfect for experienced traders who want a clean chart
### 🚫 Anti-Overlap System
- **Minimum Bars Between Patterns** setting
- Prevents cluttered charts with overlapping patterns
- Ensures only the most recent, valid patterns are displayed
- Adjustable from 5 to 50 bars
### 🔔 Smart Alert System
- **3 Alert Types**: Buy Signal, Sell Signal, Any Signal
- **Signal Tester Compatible**: Works with backtesting tools
- **alertcondition()** method for TradingView alerts
- Get notified immediately when patterns complete
---
## 🚀 Quick Start Guide
### Recommended Settings (Beginners)
```
ZigZag Length: 12
Sensitivity: Medium
PRZ Opacity: 40
Fill Opacity: 30
Entry on Next Candle: false
Simplified Mode: false
Min Bars Between Patterns: 15
```
### For Live Trading
```
Entry on Next Candle: true ← Important!
```
### For Clean Charts
```
Simplified Mode: true
```
---
## 📊 Best Practices
### Timeframes
- **Best**: 4H, Daily, Weekly
- **Good**: 1H, 2H
- **Acceptable**: 15m, 30m
### Markets
Works on **all markets**: Forex, Stocks, Crypto, Commodities, Indices
### Risk Management
- Risk per trade: 1-2% of account
- Stop Loss: Use indicator's calculated SL
- Profit Targets: Scale out at TP1, TP2, TP3
- Minimum R:R: 1:2
---
## 🎓 Trading Strategies
### Strategy 1: Conservative
- Sensitivity: Strict
- Entry on Next Candle: true
- Confirm with RSI/MACD
### Strategy 2: Aggressive
- Sensitivity: Medium-Loose
- Quick entry and exit
- Scale out at TP1, TP2
### Strategy 3: Swing Trading
- Sensitivity: Strict
- Timeframe: 4H, Daily
- Hold to TP3
### Strategy 4: Multi-Timeframe
- Identify pattern on higher timeframe
- Enter on lower timeframe pattern
---
## 🔔 Setting Up Alerts
1. Right-click on chart → **"Add Alert"**
2. Condition → **"Harmonic Patterns Pro 1.0 "**
3. Choose: Buy Signal / Sell Signal / Any Signal
4. Click **"Create"**
---
## ❓ FAQ
**Q: Does this indicator repaint?**
A: No. 100% non-repainting.
**Q: What's the best sensitivity setting?**
A: Start with "Medium".
**Q: How many patterns should I expect?**
A: Daily: 1-3/month. 1H: 5-10/week.
**Q: Can I use this for backtesting?**
A: Yes! Compatible with Signal Tester.
**Q: Should I trade every pattern?**
A: No. Focus on quality setups.
**Q: What's the typical win rate?**
A: Beginners: 40-50%, Advanced: 65-75%.
---
## 🎯 Why Choose This Indicator?
✅ **Comprehensive** - All 10 patterns in one
✅ **Reliable** - 100% non-repainting
✅ **Professional** - Clean, customizable design
✅ **Complete** - Entry, targets, stop loss included
✅ **User-Friendly** - Easy to use
✅ **Flexible** - Works on all markets and timeframes
---
## ⚠️ Disclaimer
This indicator is a tool for technical analysis and should not be considered financial advice. Trading involves substantial risk of loss. Always use proper risk management and never risk more than you can afford to lose.
---
## 🏆 Final Words
**Harmonic Patterns Pro 1.0** combines classical harmonic pattern theory with modern automation. Start identifying high-probability reversal zones today!
**Version**: 1.0 | **Author**: | **Last Updated**: October 2025
**Happy Trading! 📊✨**
---
---
---
# ═══════════════════════════════════════════════════════════
# 🌟 النسخة العربية | ARABIC VERSION 🌟
# ═══════════════════════════════════════════════════════════
---
---
---
# مؤشر نماذج الهارمونيك الاحترافي 1.0
## 📊 كاشف احترافي لنماذج الهارمونيك - جميع النماذج العشرة الكلاسيكية
**مؤشر نماذج الهارمونيك الاحترافي** هو مؤشر شامل وغير معاد الرسم يكتشف ويعرض تلقائياً جميع نماذج الهارمونيك الكلاسيكية العشرة في الوقت الفعلي. تم بناؤه بدقة ومع وضع المتداولين المحترفين في الاعتبار، يساعدك هذا المؤشر على تحديد مناطق الانعكاس عالية الاحتمالية بناءً على نسب فيبوناتشي.
---
## ✨ الميزات الرئيسية
### 🎯 دعم 10 نماذج هارمونيك
- **Gartley (جارتلي)** - النموذج الأكثر شيوعاً
- **Bat (الخفاش)** - دقة عالية مع وقف خسارة ضيق
- **Butterfly (الفراشة)** - نموذج ممتد مع إمكانية انعكاس قوية
- **Crab (السلطعون)** - نموذج امتداد متطرف (1.618 XA)
- **Deep Crab (السلطعون العميق)** - نسخة أعمق من السلطعون
- **Shark (القرش)** - نموذج فريد بامتداد النقطة C
- **Cypher (السايفر)** - C تمتد بعد A، وقف خسارة ضيق
- **AB=CD** - نموذج بسيط بأرجل متساوية
- **Alternate Bat (الخفاش البديل)** - نسخة من الخفاش مع D بعد X
- **Three Drives (الدفعات الثلاث)** - ثلاث حركات دفع متساوية
### 🔒 عدم إعادة الرسم 100%
- يتم رسم النماذج **فقط بعد الاكتمال** (إغلاق الشمعة)
- بمجرد الرسم، تبقى النماذج **بشكل دائم** على الشارت
- لا يتم استخدام بيانات مستقبلية - موثوق تماماً للتداول المباشر
- ما تراه في التاريخ هو ما تحصل عليه في الوقت الفعلي
### 🎚️ 5 مستويات حساسية
اختر دقة الكشف التي تناسب أسلوب التداول الخاص بك:
- **Strict (صارم ±2%)** - أعلى دقة، إشارات أقل
- **Medium-Strict (متوسط-صارم ±5%)** - توازن جيد
- **Medium (متوسط ±8%)** - موصى به لمعظم المتداولين
- **Medium-Loose (متوسط-مرن ±12%)** - اكتشاف المزيد من النماذج
- **Loose (مرن ±18%)** - أقصى اكتشاف للنماذج
### 🎨 تصميم مرئي متقدم
- **منطقة PRZ**: تمييز تلقائي لمنطقة الانعكاس المحتملة
- **تظليل النموذج**: منطقة مظللة بين خطوط النموذج للوضوح
- **نقاط XABCD**: تسمية واضحة لجميع نقاط المحور
- **ترميز لوني**: أخضر للنماذج الصاعدة، أحمر للنماذج الهابطة
- **قابل للتخصيص**: ضبط الألوان، الشفافية، أنماط الخطوط، أحجام الملصقات
### 📈 نظام تداول كامل
- **إشارات الدخول**: ملصقات BUY/SELL واضحة عند النقطة D
- **3 أهداف ربح**: TP1 (38.2%)، TP2 (61.8%)، TP3 (100% CD)
- **وقف الخسارة**: يتم حسابه وعرضه تلقائياً
- **توقيت الدخول**: خيار للدخول عند D أو الشمعة التالية
- **أسماء النماذج**: كل نموذج مُسمى (مثل "Bullish Bat")
### 🧹 الوضع المبسط
- تبديل لإخفاء جميع الزخارف
- يعرض فقط: إشارات BUY/SELL، الأهداف، ووقف الخسارة
- مثالي للمتداولين ذوي الخبرة الذين يريدون شارت نظيف
### 🚫 نظام منع التداخل
- إعداد **الحد الأدنى من الشموع بين النماذج**
- يمنع الشارت المزدحم بالنماذج المتداخلة
- يضمن عرض النماذج الأحدث والصالحة فقط
- قابل للتعديل من 5 إلى 50 شمعة
### 🔔 نظام تنبيهات ذكي
- **3 أنواع تنبيهات**: إشارة شراء، إشارة بيع، أي إشارة
- **متوافق مع Signal Tester**: يعمل مع أدوات الاختبار الخلفي
- طريقة **alertcondition()** لتنبيهات TradingView
- احصل على إشعار فوري عند اكتمال النماذج
---
## 🚀 دليل البدء السريع
### الإعدادات الموصى بها (للمبتدئين)
```
ZigZag Length: 12
Sensitivity: Medium
PRZ Opacity: 40
Fill Opacity: 30
Entry on Next Candle: false
Simplified Mode: false
Min Bars Between Patterns: 15
```
### للتداول المباشر
```
Entry on Next Candle: true ← مهم!
```
### للشارت النظيف
```
Simplified Mode: true
```
---
## 📊 أفضل الممارسات
### الأطر الزمنية
- **الأفضل**: 4 ساعات، يومي، أسبوعي
- **جيد**: ساعة، ساعتين
- **مقبول**: 15 دقيقة، 30 دقيقة
### الأسواق
يعمل على **جميع الأسواق**: الفوركس، الأسهم، العملات الرقمية، السلع، المؤشرات
### إدارة المخاطر
- المخاطرة لكل صفقة: 1-2% من الحساب
- وقف الخسارة: استخدم SL المحسوب من المؤشر
- أهداف الربح: خذ أرباح تدريجية عند TP1، TP2، TP3
- الحد الأدنى للمخاطرة/العائد: 1:2
---
## 🎓 استراتيجيات التداول
### الاستراتيجية 1: المحافظة
- الحساسية: Strict (صارم)
- الدخول من الشمعة التالية: true
- التأكيد مع RSI/MACD
### الاستراتيجية 2: العدوانية
- الحساسية: Medium-Loose (متوسط-مرن)
- دخول وخروج سريع
- أخذ أرباح تدريجية عند TP1، TP2
### الاستراتيجية 3: السوينج
- الحساسية: Strict (صارم)
- الإطار الزمني: 4 ساعات، يومي
- الاحتفاظ حتى TP3
### الاستراتيجية 4: متعدد الأطر الزمنية
- تحديد النموذج على إطار زمني أعلى
- الدخول على نموذج إطار زمني أقل
---
## 🔔 إعداد التنبيهات
1. انقر بزر الماوس الأيمن على الشارت → **"Add Alert"**
2. الشرط → **"Harmonic Patterns Pro 1.0 "**
3. اختر: Buy Signal / Sell Signal / Any Signal
4. اضغط **"Create"**
---
## ❓ الأسئلة الشائعة
**س: هل يعيد المؤشر الرسم؟**
ج: لا. عدم إعادة الرسم 100%.
**س: ما هو أفضل إعداد للحساسية؟**
ج: ابدأ بـ "Medium" (متوسط).
**س: كم عدد النماذج المتوقعة؟**
ج: يومي: 1-3 شهرياً. ساعة: 5-10 أسبوعياً.
**س: هل يمكنني استخدامه للاختبار الخلفي؟**
ج: نعم! متوافق مع Signal Tester.
**س: هل يجب أن أتداول كل نموذج؟**
ج: لا. ركز على الإعدادات عالية الجودة.
**س: ما هو معدل الربح النموذجي؟**
ج: المبتدئون: 40-50%، المتقدمون: 65-75%.
---
## 🎯 لماذا تختار هذا المؤشر؟
✅ **شامل** - جميع النماذج العشرة في مؤشر واحد
✅ **موثوق** - عدم إعادة الرسم 100%
✅ **احترافي** - تصميم نظيف وقابل للتخصيص
✅ **كامل** - الدخول، الأهداف، ووقف الخسارة مشمولة
✅ **سهل الاستخدام** - سهل الاستخدام
✅ **مرن** - يعمل على جميع الأسواق والأطر الزمنية
---
## ⚠️ إخلاء المسؤولية
هذا المؤشر هو أداة للتحليل الفني ولا ينبغي اعتباره نصيحة مالية. التداول ينطوي على مخاطر كبيرة للخسارة. استخدم دائماً إدارة المخاطر المناسبة ولا تخاطر أبداً بأكثر مما يمكنك تحمل خسارته.
---
## 🏆 الكلمة الأخيرة
**مؤشر نماذج الهارمونيك الاحترافي 1.0** يجمع بين نظرية نماذج الهارمونيك الكلاسيكية والأتمتة الحديثة. ابدأ في تحديد مناطق الانعكاس عالية الاحتمالية اليوم!
**الإصدار**: 1.0 | **المطور**: | **آخر تحديث**: أكتوبر 2025
**تداول موفق! 📊✨**
HEMA Trend Levels [AlgoAlpha]This indicator analyzes trend, momentum, volume and liquidity traps to generate LONG/SHORT signals.
It also includes automatic support/resistance zones, volatility warnings, and a risk panel.
Features:
EMA, DEMA, RSI, MACD, ADX, HTF EMA confirmations
ATR-based TP1 / TP2 targets with trailing SL
Liquidity trap / wick detection
Pump/dump movement alarms
Colored Heikin Ashi candles
Automatic support/resistance zones (pivot-based)
Top-right panel with trend, RSI, MACD, volume/ADX, active trade and risk score
How to Use:
Timeframes: Best for 1m–15m scalping, 1H–4H swing trading.
Signals: “BUY” label → Long entry, “SELL” label → Short entry.
Zones: Green = support, Red = resistance.
Alerts: High ATR = reduce leverage, Bot trap = caution.
Panel: When trend & confirmations align, the signal is stronger.
SZO - Signal Zone Oscillator ## Signal Zone Oscillator - SZO
**Created by:** @TraderCurses
**Version:** 1.0 (October 2025)
### ▌ OVERVIEW
The Signal Zone Oscillator (SZO) is a comprehensive momentum tool designed to provide a clearer, more nuanced view of market dynamics. It synthesizes three of the most powerful classic indicators—RSI, a unique MACD Ratio, and the Stochastic oscillator—into a single, unified signal.
The indicator's core feature is the **"Signal Zone"**: a colored area between the main oscillator line and its moving average filter. This zone makes it incredibly easy to visualize shifts in momentum, trends, and potential entry/exit points.
### ▌ KEY FEATURES
* **Composite Formula:** Combines RSI, MACD Ratio, and Stochastic using a weighted average to measure underlying market momentum.
* **The Signal Zone:** The flagship feature. The area between the SZO line and its filter is colored **green** in a bullish context (SZO above filter) and **red** in a bearish context (SZO below filter).
* **Dynamic Coloring:** Both the main SZO line and its filter change color dynamically, providing instant feedback on direction and strength.
* **Zero-Line Reference:** A dashed zero line acts as a classic equilibrium level, helping to confirm stronger bullish or bearish momentum.
* **Fully Customizable:** Every parameter is adjustable. You can change the lengths, sources, and even the weights of the core indicators from the settings menu.
* **Built-in Alerts:** Comes with pre-configured alerts for crossovers of the filter and the zero line, allowing you to automate your monitoring.
### ▌ HOW TO USE IT
The SZO provides several clear signals for traders:
1. **Bullish Signal:**
* The SZO line crosses **above** its filter.
* The Signal Zone turns **green**.
* A cross above the zero line can be used as further confirmation of strong bullish momentum.
2. **Bearish Signal:**
* The SZO line crosses **below** its filter.
* The Signal Zone turns **red**.
* A cross below the zero line can be used as further confirmation of strong bearish momentum.
3. **Divergences:**
* Like any oscillator, look for divergences between the SZO's peaks/troughs and the price action to spot potential reversals.
This tool is designed for traders who want to cut through the noise and get a clear, actionable signal from multiple momentum sources at once. Happy trading!
